


Since Torkel Ödegaard started the Grafana open source project in 2013, it has grown to become one of the most popular dashboard technologies in the world, with more than 550,000 active installations. Along the way, Grafana has had .0 releases every year. But Grafana 7.0 was truly a major release for the project: It represents a fundamental, system-wide advancement.
At Grafana Labs, the company behind Grafana, we believe vendors shouldn’t own observability strategies; users and organizations do. And the changes we’ve made in Grafana 7.0 go a long way toward making that philosophy a reality. We hope you’ll find these new features as exciting as we do.
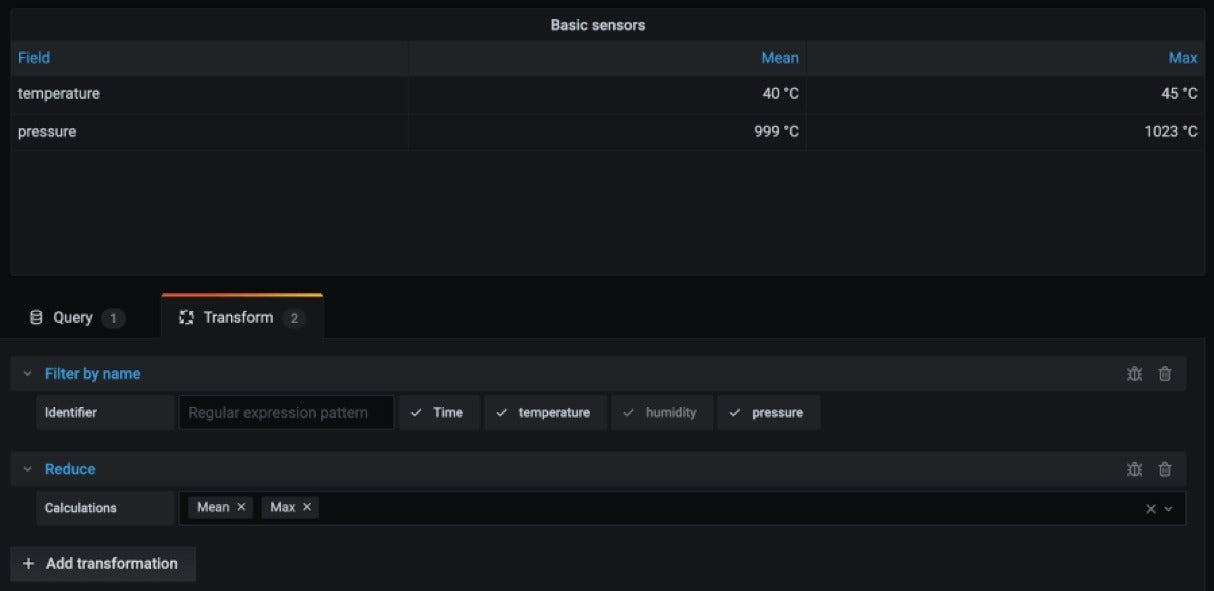
Data transformations
Before Grafana 7.0, transformations were done as custom features in each data source plug-in or as part of a specific panel plug-in’s data processing — for example, the old table panel’s transformation option and the Prometheus table query mode. This query-level option triggers a simple data transformation that is done in the data source front-end code that transforms time series labels to table columns.
In Grafana 7.0 data transformations are now a core part of the data processing that happens before the visualization step, and are available to all data sources that return time series with labels and all visualization types. This means you can combine non time series data with any other data in Grafana — be it data from an external database or a panel that already exists in one of your current dashboards.
Here are some examples:
- Re-order and rename table columns.
- Summarize different queries.
- Add a custom data calculation field.
- Reuse query results (or streams) across many panels, and each panel can filter out specific parts to visualize.
 Grafana Labs
Data inspection and export
Being able to view data underlying a visualization — especially those that perform aggregations and rounding — can help verify the visualization and troubleshoot problems with the query. In Grafana 7.0, a new panel inspector allows you to:
- View raw query results in a table. This will work for any panel — old and new, internal and external.
- Perform simple data transformations on this raw data table, like pivot and join.
- Export to CSV.
- View query stats.
- View detailed query execution inspection including details on how the query was executed, rollups used, etc.
Support for distributed tracing
We added major support for distributed tracing to complement Grafana’s existing support for metrics and logs. Traces allow you to follow how single requests traveled through a distributed system. There is now an integrated trace viewer and two new built-in data sources: Jaeger and Zipkin. The first workflows between the telemetry modes are already implemented: Loki logs can detect trace IDs in the log lines and pull up the trace itself from the Jaeger data source.
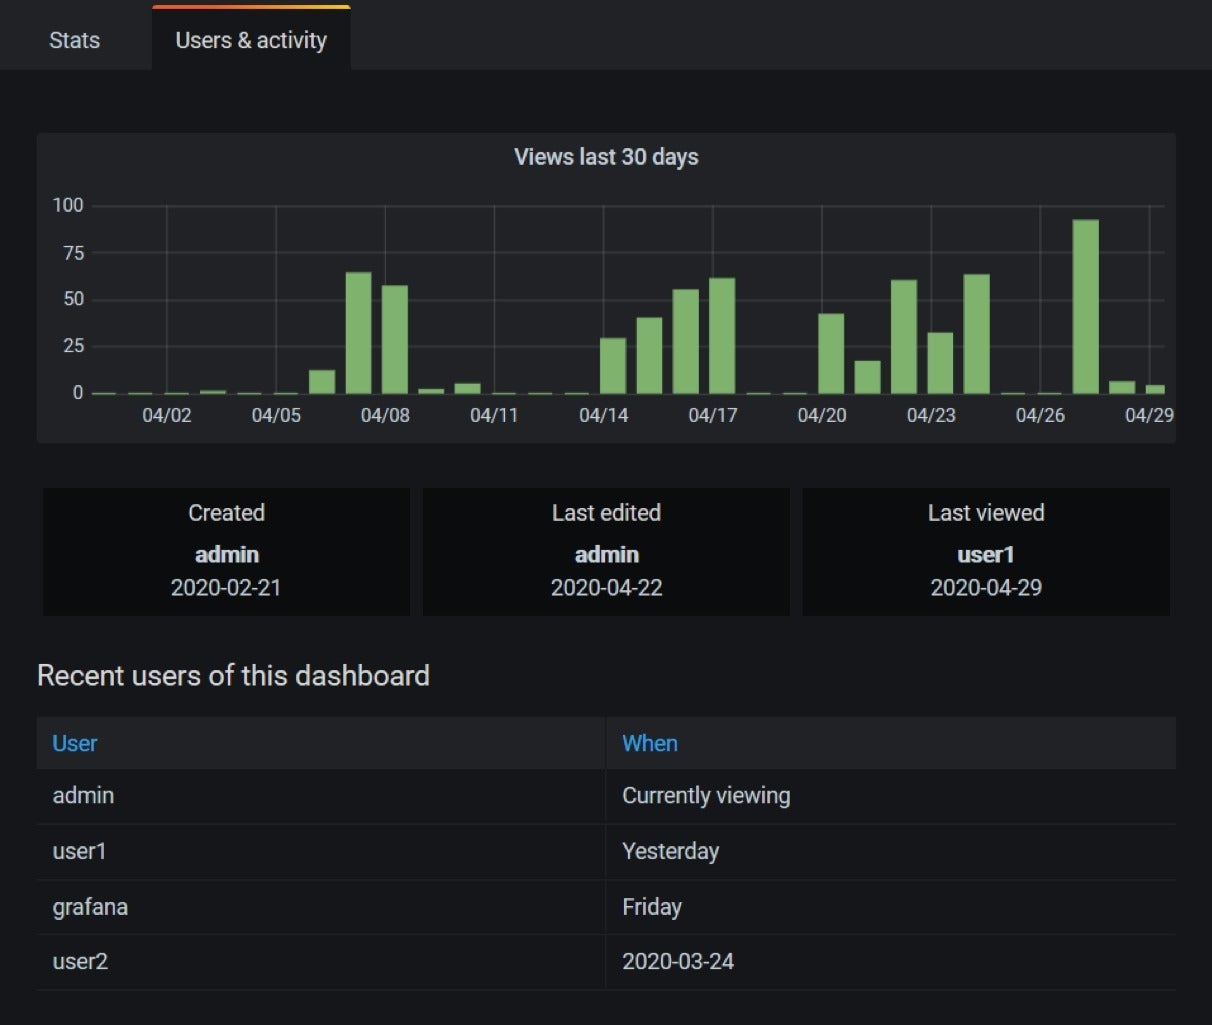
Grafana usage insights
In Grafana 7.0 we introduced a series of features that build on our new usage analytics engine. When you open a dashboard, you will see a presence indicator of who else is viewing the same dashboard. You can also see recent dashboard usage and sort dashboards by usage. This enables organizations to identify and remove unused dashboards, and helps team members find others who are seeing the same thing and investigate a production issue together.
 Grafana Labs
Unified data model
There’s a new unified way to describe data. Attributes like unit, min, max, thresholds, and data links, as well as custom visualization options, are now part of a unified data structure that can be set directly by data sources, conventions, user defaults, and override rules. Users can now see and learn a single UI for setting data options and override rules. This makes switching visualizations much smoother. For instance, you can switch from a stat panel to a graph panel and keep a lot of the same settings.
New plug-in platform
With Grafana 7.0, we announced the beta of our next generation plug-in platform and component libraries. Features include a new React component library, new tools for building plug-ins, new data structures, signed plug-ins, and support for building plug-ins in React — all of which should speed up plug-in development for the Grafana team and anyone else who wants to build plug-ins, not just our hardcore users. For more information, check out the docs for plug-in development.
Query history in Grafana Explore
Explore is becoming the place in Grafana where you troubleshoot your system by quickly iterating through your queries. We’ve added a query history area that keeps a list of all of your recently run queries so you can revisit them later. You can also comment or “star” them so you can find your favorite queries later. It’s a super useful feature for troubleshooting.
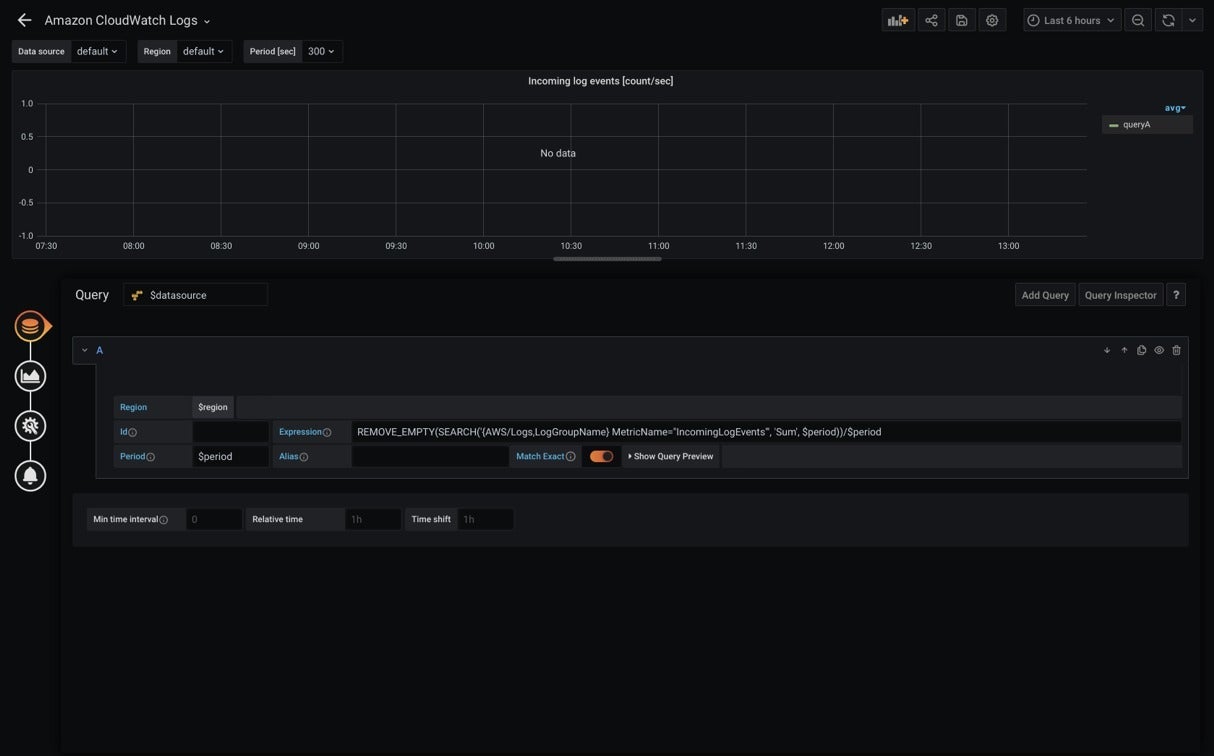
Amazon CloudWatch logs
We added logging support to one of our most popular cloud provider data sources, so that Grafana can improve the observability story for AWS. In Grafana, it will be easier to investigate issues in AWS by linking Amazon CloudWatch metrics to CloudWatch logs.
 Grafana Labs
Metrictank rollup indicator and metadata inspector
A series can be consolidated due to rollups, normalization, or runtime consolidation. If this consolidation doesn’t use the appropriate function, a chart may be wrong and confusing. So we built a feature that gives you a high-level breakdown of all the data displayed on your charts: How did the data come about? How many series are from rollup archives? How were they consolidated or normalized? The new panel inspector, mentioned above, can show all lineage information.
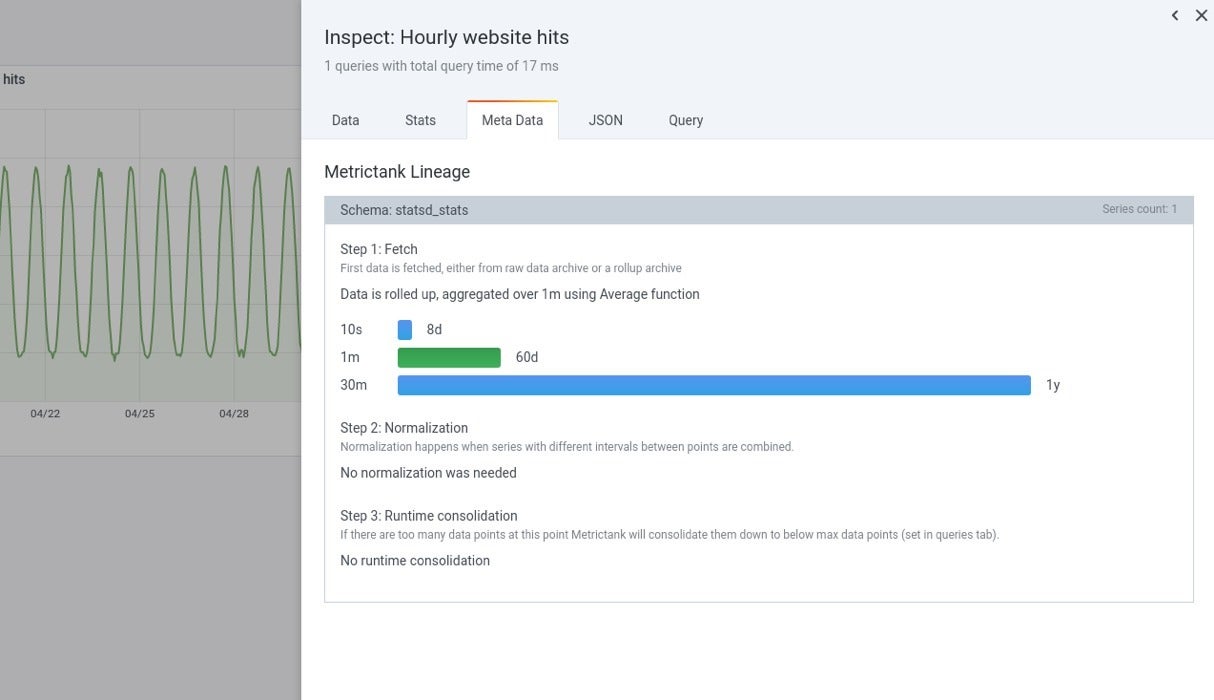 Grafana Labs
New table panel
And last but not least, Grafana 7.0 added a brand-new table panel. The old table panel accumulated a lot of feature requests over the years, and we were excited to finally close many of them. Among the new things this panel can do is to include other visualizations inside cells. For example, you can configure a cell style (per column) to render the value as a bar gauge. With our new panel architecture and style override system, it will be easy for us to add many new cell display styles in the future — think sparklines, images, and bar graphs inside table cells.
I hope you’ll get a chance to try out Grafana 7.0. Let us know what you think!
Daniel Lee, a core contributor to Grafana, is a manager at Grafana Labs. Previously, he worked at eBay Sweden where his team used Grafana to monitor their infrastructure, record application metrics, and carry out A/B testing. Daniel has been involved in open source for years. He is also passionate about metrics and monitoring.