Every programming language has two kinds of speed: speed of development, and speed of execution. Python has always favored writing fast versus running fast. Although Python code is almost always fast enough for the task, sometimes it isn’t. In those cases, you need to find out where and why it lags, and do something about it.
A well-respected adage of software development, and engineering generally, is “Measure, don’t guess.” With software, it’s easy to assume what’s wrong, but never a good idea to do so. Statistics about actual program performance are always your best first tool in the pursuit of making applications faster.
The good news is, Python offers a whole slew of packages you can use to profile your applications and learn where it’s slowest. These tools range from simple one-liners included with the standard library to sophisticated frameworks for gathering stats from running applications. Here I cover nine of the most significant, most of which run cross-platform and are readily available either in PyPI or in Python’s standard library.
Time and Timeit
Sometimes all you need is a stopwatch. If all you’re doing is profiling the time between two snippets of code that take seconds or minutes on end to run, then a stopwatch will more than suffice.
The Python standard library comes with two functions that work as stopwatches. The Time module has the perf_counter function, which calls on the operating system’s high-resolution timer to obtain an arbitrary timestamp. Call time.perf_counter once before an action, once after, and obtain the difference between the two. This gives you an unobtrusive, low-overhead—if also unsophisticated—way to time code.
The Timeit module attempts to perform something like actual benchmarking on Python code. The timeit.timeit function takes a code snippet, runs it many times (the default is 1 million passes), and obtains the total time required to do so. It’s best used to determine how a single operation or function call performs in a tight loop—for instance, if you want to determine if a list comprehension or a conventional list construction will be faster for something done many times over. (List comprehensions usually win.)
The downside of Time is that it’s nothing more than a stopwatch, and the downside of Timeit is that its main use case is microbenchmarks on individual lines or blocks of code. These modules only work if you’re dealing with code in isolation. Neither one suffices for whole-program analysis—finding out where in the thousands of lines of code your program spends most of its time.
cProfile
The Python standard library also comes with a whole-program analysis profiler, cProfile. When run, cProfile traces every function call in your program and generates a list of which functions were called most often and how long the calls took on average.
cProfile has three big strengths. One, it’s included with the standard library, so it’s available even in a stock Python installation. Two, it profiles a number of different statistics about call behavior—for instance, it separates out the time spent in a function call’s own instructions from the time spent by all the other calls invoked by the function. This lets you determine whether a function is slow itself or it’s calling other functions that are slow.
Three, and perhaps best of all, you can constrain cProfile freely. You can sample a whole program’s run, or you can toggle profiling on only when a select function runs, the better to focus on what that function is doing and what it is calling. This approach works best only after you’ve narrowed things down a bit, but saves you the trouble of having to wade through the noise of a full profile trace.
Which brings us to the first of cProfile’s drawbacks: It generates a lot of statistics by default. Trying to find the right needle in all that hay can be overwhelming. The other drawback is cProfile’s execution model: It traps every single function call, creating a significant amount of overhead. That makes cProfile unsuitable for profiling apps in production with live data, but perfectly fine for profiling them during development.
For a more detailed rundown of cProfile, see our separate article.
FunctionTrace
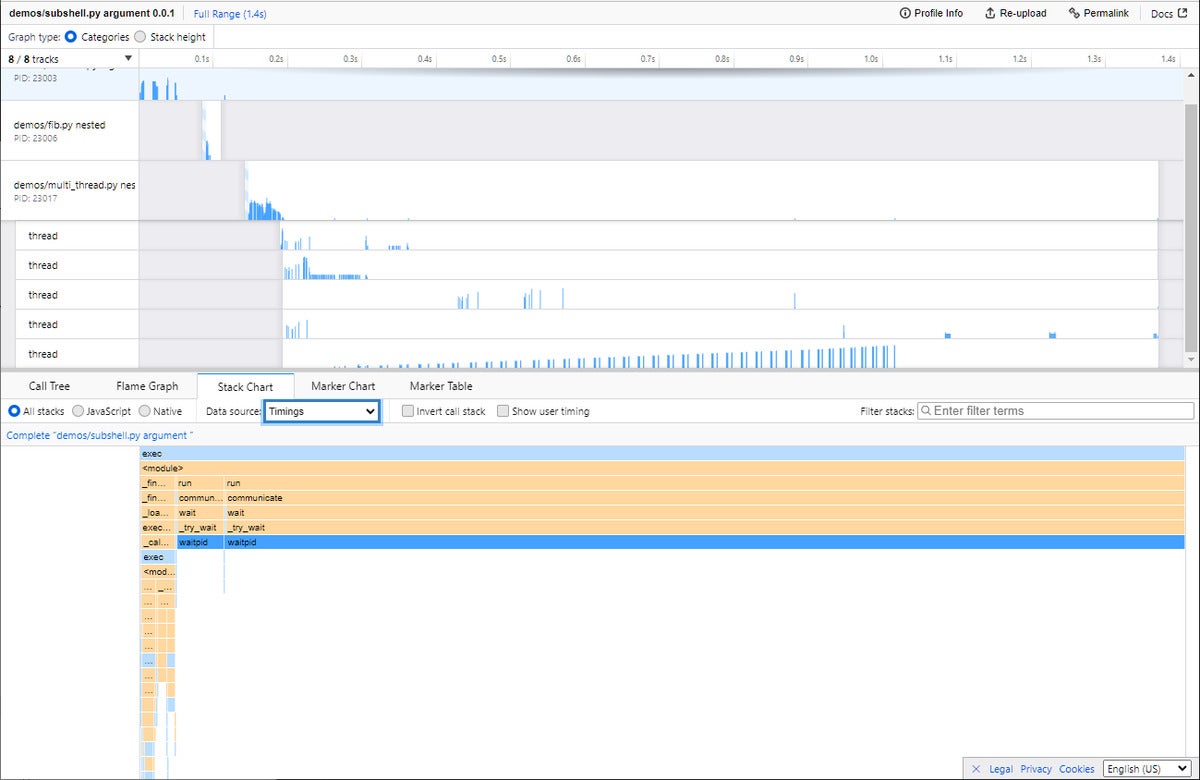
FunctionTrace works like cProfile in its general outlines: You pass it the name of the script you want to profile, without having to add instrumentation to the code, and it generates a detailed trace of function calls and memory usage over time. FunctionTrace also handles multithreaded/multiprocess applications without your having to do anything extra. See this article for the technical details behind how FunctionTrace works.
Like cProfile, FunctionTrace does not use sampling; every action is recorded. The profiling components are written in Rust for speed. FunctionTrace’s developers claim the profiling overhead imposed on applications is less than 10%.
Trace data is saved in JSON format, so you can in theory use any application to parse it. But FunctionTrace’s big advantage is that it uses the Firefox Profiler—which will run in any JavaScript-enabled browser, not just Firefox—to render the results to an interactive graph.
Note that FunctionTrace’s profiling components are not yet available on Windows; profiling can only be performed on Linux or Mac systems.
 IDG
IDG
FunctionTrace uses the Firefox Profiler (which can run in any JavaScript-enabled browser) to make trace statistics interactive and explorable.
Palanteer
A relatively new addition to the Python profiling arsenal, Palanteer can be used to profile both Python and C++ programs. This makes it highly useful if you’re writing a Python application that wraps C++ libraries of your own creation, and you want the most granular insight into both components of your app. Best of all, Palanteer displays the results in a GUI app that runs on the desktop, updated live as your program runs.
Instrumenting Python applications is as simple as running the app through Palanteer, in the same way one uses cProfile. Function calls, exceptions, garbage collection, and OS-level memory allocations are all tracked. These last two are especially useful if your app’s performance issues turn out to be related to memory usage or object allocations.
One big downside of Palanteer, at least right now, is that you must build it entirely from source. No precompiled binaries are available as installable Python wheels yet, so you’ll need to break out your C++ compiler and have a copy of CPython’s source handy, too.
Pyinstrument
Pyinstrument works like cProfile in that it traces your program and generates reports about the code that is occupying most of its time. But Pyinstrument has two major advantages over cProfile that make it worth trying out.
First, Pyinstrument doesn’t attempt to hook every single instance of a function call. It samples the program’s call stack every millisecond, so it’s less obtrusive but still sensitive enough to detect what’s eating most of your program’s runtime.
Second, Pyinstrument’s reporting is far more concise. It shows you the top functions in your program that take up the most time, so you can focus on analyzing the biggest culprits. It also lets you find those results quickly, with little ceremony.
Pyinstrument also has many of cProfile’s conveniences. You can use the profiler as an object in your application, and record the behavior of selected functions instead of the whole application. The output can be rendered any number of ways, including as HTML. If you want to see the full timeline of calls, you can demand that too.
Two caveats also come to mind. First, some programs that use C-compiled extensions, such as those created with Cython, may not work properly when invoked with Pyinstrument through the command line. But they do work if Pyinstrument is used in the program itself—e.g., by wrapping a main() function with a Pyinstrument profiler call.
The second caveat: Pyinstrument doesn’t deal well with code that runs in multiple threads. Py-spy, detailed below, may be the better choice there.
Py-spy
Py-spy, like Pyinstrument, works by sampling the state of a program’s call stack at regular intervals, instead of trying to record every single call. Unlike PyInstrument, Py-spy has core components written in Rust (Pyinstrument uses a C extension) and runs out-of-process with the profiled program, so it can be used safely with code running in production.
This architecture allows Py-spy to easily do something many other profilers can’t: profile multithreaded or subprocessed Python applications. Py-spy can also profile C extensions, but those need to be compiled with symbols to be useful. And in the case of extensions compiled with Cython, the generated C file needs to be present to gather proper trace information.
There are two basic ways to inspect an app with Py-spy. You can run the app using Py-spy’s record command, which generates a flame graph after the run concludes. Or you can run the app using Py-spy’s top command, which brings up a live-updated, interactive display of your Python app’s innards, displayed in the same manner as the Unix top utility. Individual thread stacks can also be dumped out from the command line.
Py-spy has one big drawback: It’s mainly intended to profile an entire program, or some components of it, from the outside. It doesn’t let you decorate and sample only a particular function.
Snakeviz
The most common way to visualize data from a cProfile trace is through another standard library module, pstats. Thing is, pstats generates plain-text reports that don’t always provide the kind of visualization you need for profile statistics.
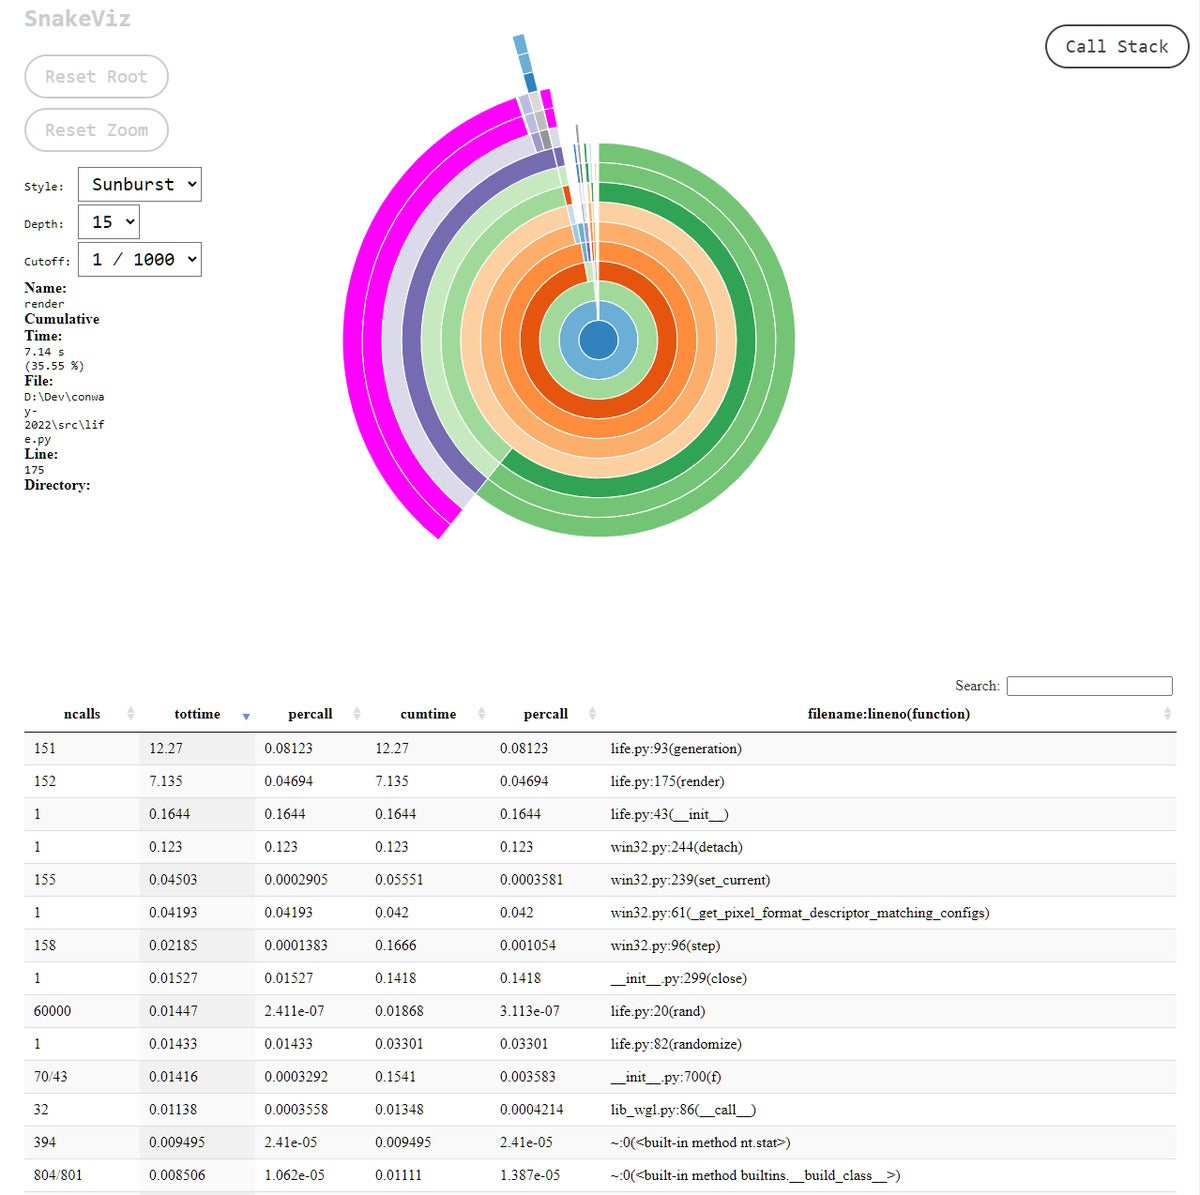
Snakeviz takes the data generated by cProfile and produces easy-to-read, interactive graphics rendered with HTML. Two kinds of plots are available: the “icicle” and the “sunburst,” each of which shows at a glance where your program is taking most of its time. Each segment of the chart represents the call time for a function. Just click a segment to zoom in on a function, and you can inspect the time taken by everything in the stack below it as well.
Snakeviz also generates a searchable and sortable HTML table view of the trace data; it’s like a more interactive version of the traces created by pstats. Even if you don’t bother with the charts, the table view of the trace is by itself a hugely powerful way to make sense of cProfile data.
 IDG
IDG
Snakeviz generates interactive charts from statistics for a Python program’s cProfile trace.
Yappi
Yappi (“Yet Another Python Profiler”) has many of the best features of the other profilers discussed here, and a few not provided by any of them. PyCharm installs Yappi by default as its profiler of choice, so users of that IDE already have built-in access to Yappi.
To use Yappi, you decorate your code with instructions to invoke, start, stop, and generate reporting for the profiling mechanisms. Yappi lets you choose between “wall time” or “CPU time” for measuring the time taken. The former is just a stopwatch; the latter clocks, via system-native APIs, how long the CPU was actually engaged in executing code, omitting pauses for I/O or thread sleeping. CPU time gives you the most precise sense of how long certain operations, such as the execution of numerical code, actually take.
One very nice advantage to the way Yappi handles retrieving stats from threads is that you don’t have to decorate the threaded code. Yappi provides a function, yappi.get_thread_stats(), that retrieves statistics from any thread activity you record, which you can then parse separately. Stats can be filtered and sorted with high granularity, similar to what you can do with cProfile.
Finally, Yappi can also profile greenlets and coroutines, something many other profilers cannot do easily or at all. Given Python’s growing use of async metaphors, the ability to profile concurrent code is a powerful tool to have.


