


Tracking errors in a way that makes them manageable is one of the most painstaking tasks for developers. In the past, we had to rebuild error tracking for every application, which often led to extraneous lines of code throughout the business logic. Sentry is an error-tracking framework that does much of the heavy lifting, providing the framework, back end, and visualization console. It also provides everything you need for low-effort integration into your JavaScript codebase.
Sentry recently announced a new optimization for its front-end JavaScript bundles that reduces the package size by about 29%. Ben Vinegar, Sentry's VP of Emerging Technology, said the company had two goals for this optimization, "One being the ability for some quick wins like the deletion of deprecated code and removal of unnecessary abstractions, and the second being larger refactoring, which enabled tree shaking and switching from JavaScript ES5 to ES6."
It's a great time to take a look at using Sentry in your JavaScript apps. If you are already using Sentry, now is the time to update your bundles.
We’ll use React for this demo to see how Sentry works in a front-end JavaScript application.
How Sentry works
To use Sentry in your React applications, you first include the Sentry library in your application directory, then initialize the framework early in the app’s lifecycle. Sentry will then gather information and report it back to the Sentry service, where you can view it in your application dashboard. Sentry offers various ways to slice and dice the information into a form that is most useful to you. It also automatically groups similar errors, making it simple to recognize high-priority problems.
Set up Sentry
The first step is to create an account with Sentry. The developer tier gives you ongoing free access.
Once you are logged in to your account, you will create a project. The main navigation is in the left-side menu on your screen. Click Projects, then Create Project in the upper left corner. Select JavaScript as your technology, then give the project a name and create the project.
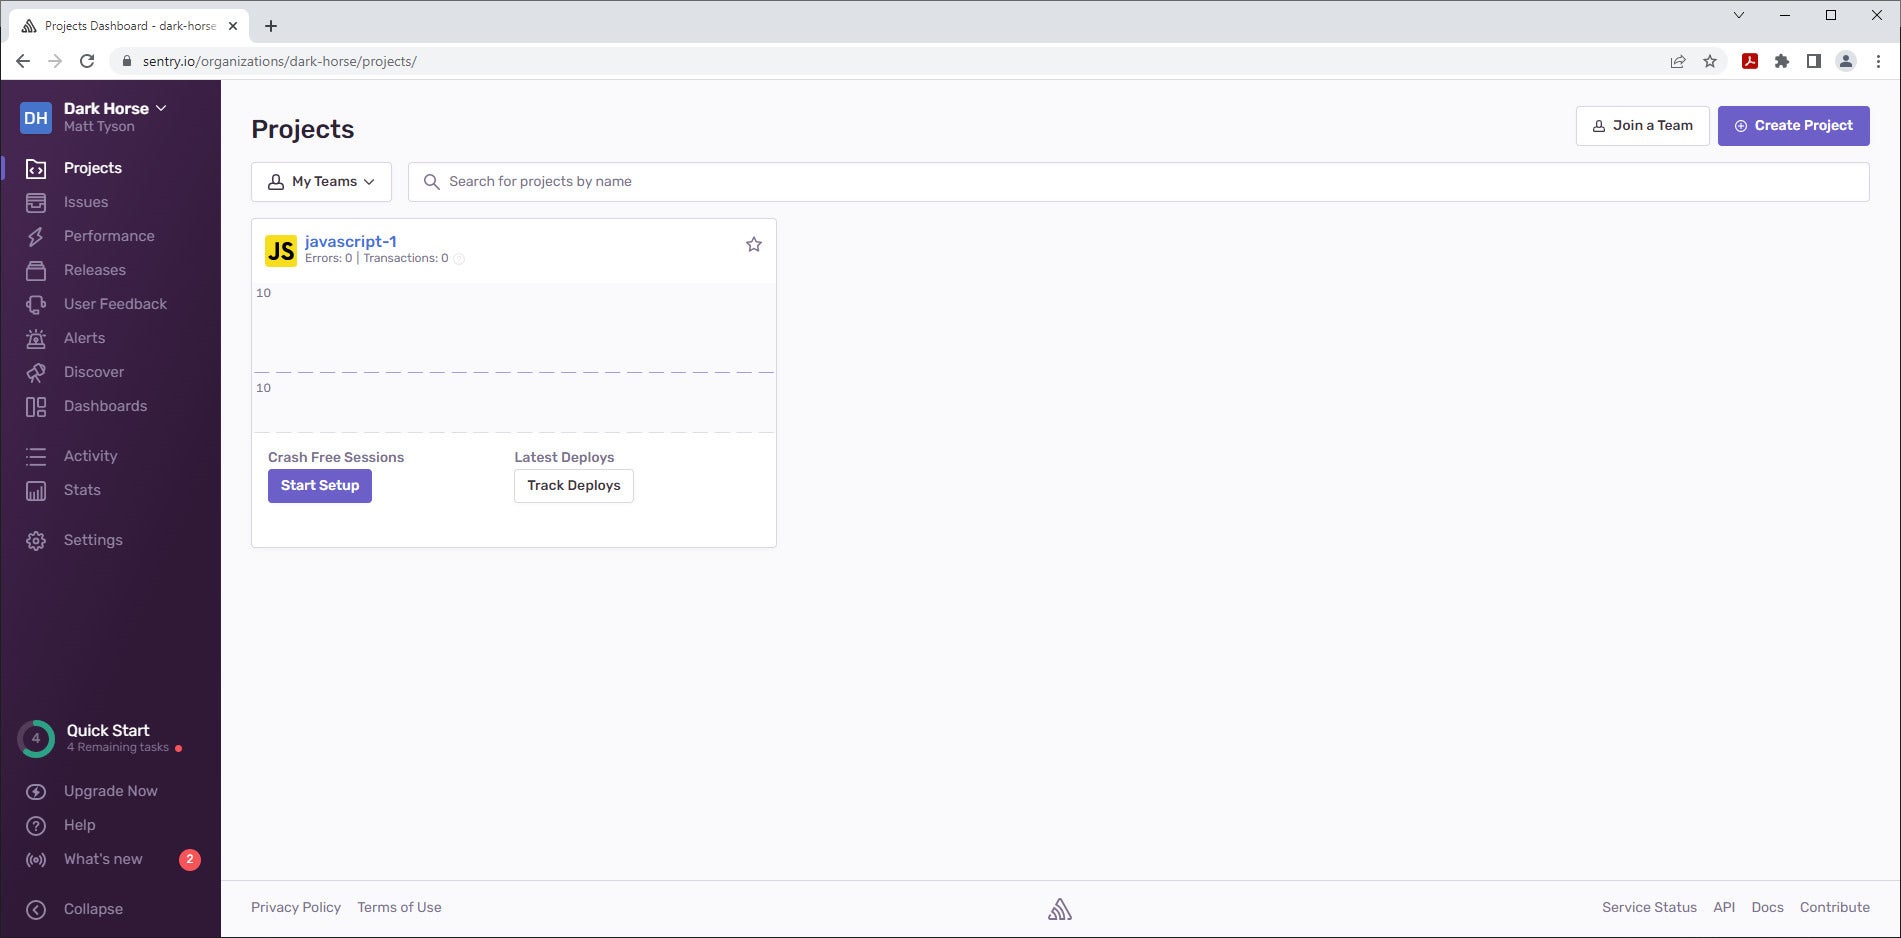
Now, your project will appear as a card in the projects pane, as shown in Figure 1. If you click the project name, Sentry will take you to the project details page. You now have a place to track issues with your app, which we'll develop next.
 IDG
IDG
Figure 1. The Sentry projects pane.
Create a React app
Let’s bootstrap a JavaScript React application on the command line by typing: npx create-react-app sentry-js. You can test that everything is running properly by typing npm run start. The UI will be visible at localhost:3000.
Next, incorporate the Sentry SDK. Note that you need to hit CTRL-C if the app is still running in dev mode or put it in the background. We’ll add two packages via NPM: npm i @sentry/browser @sentry/tracing.
Your project has a unique ID that is associated with a unique URL, called the DSN (data source name). This is where your error reports go. You can find your project's URL by opening its details pane and clicking the Installation Instructions link (the one next to what looks like a friendly imperial droid). The code snippet in the middle is the one we want to incorporate in our project.
Now, we want to add the API to the code early in the application's loading, so open /src/index.js and put the snippet in there. It will be something like what's shown in Listing 1.
Listing 1. Add the Sentry SDK to index.js
import React from 'react';
import ReactDOM from 'react-dom/client';
import './index.css';
import App from './App';
import reportWebVitals from './reportWebVitals';

import * as Sentry from "@sentry/browser";
import { BrowserTracing } from "@sentry/tracing";

Sentry.init({
  dsn: "https://<YOUR-DSN-HERE>",
  integrations: [new BrowserTracing()],

  tracesSampleRate: 1.0
});

const root = ReactDOM.createRoot(document.getElementById('root'));
root.render(
  <React.StrictMode>
    <App />
  </React.StrictMode>
);

reportWebVitals();
Now let’s create an error. Open /src/App.js and add the button element, as shown in Listing 2.
Listing 2. Add an error button to /src/App.js
<button onClick={() => {throw new Error('FooBar Error');}}>Make another Error</button>
<a className="App-link" href="https://reactjs.org" target="_blank" rel="noopener noreferrer">
When clicked, this button will throw an error. Reload the dev app and click it. Sentry will automatically report on it without any explicit instrumentation.
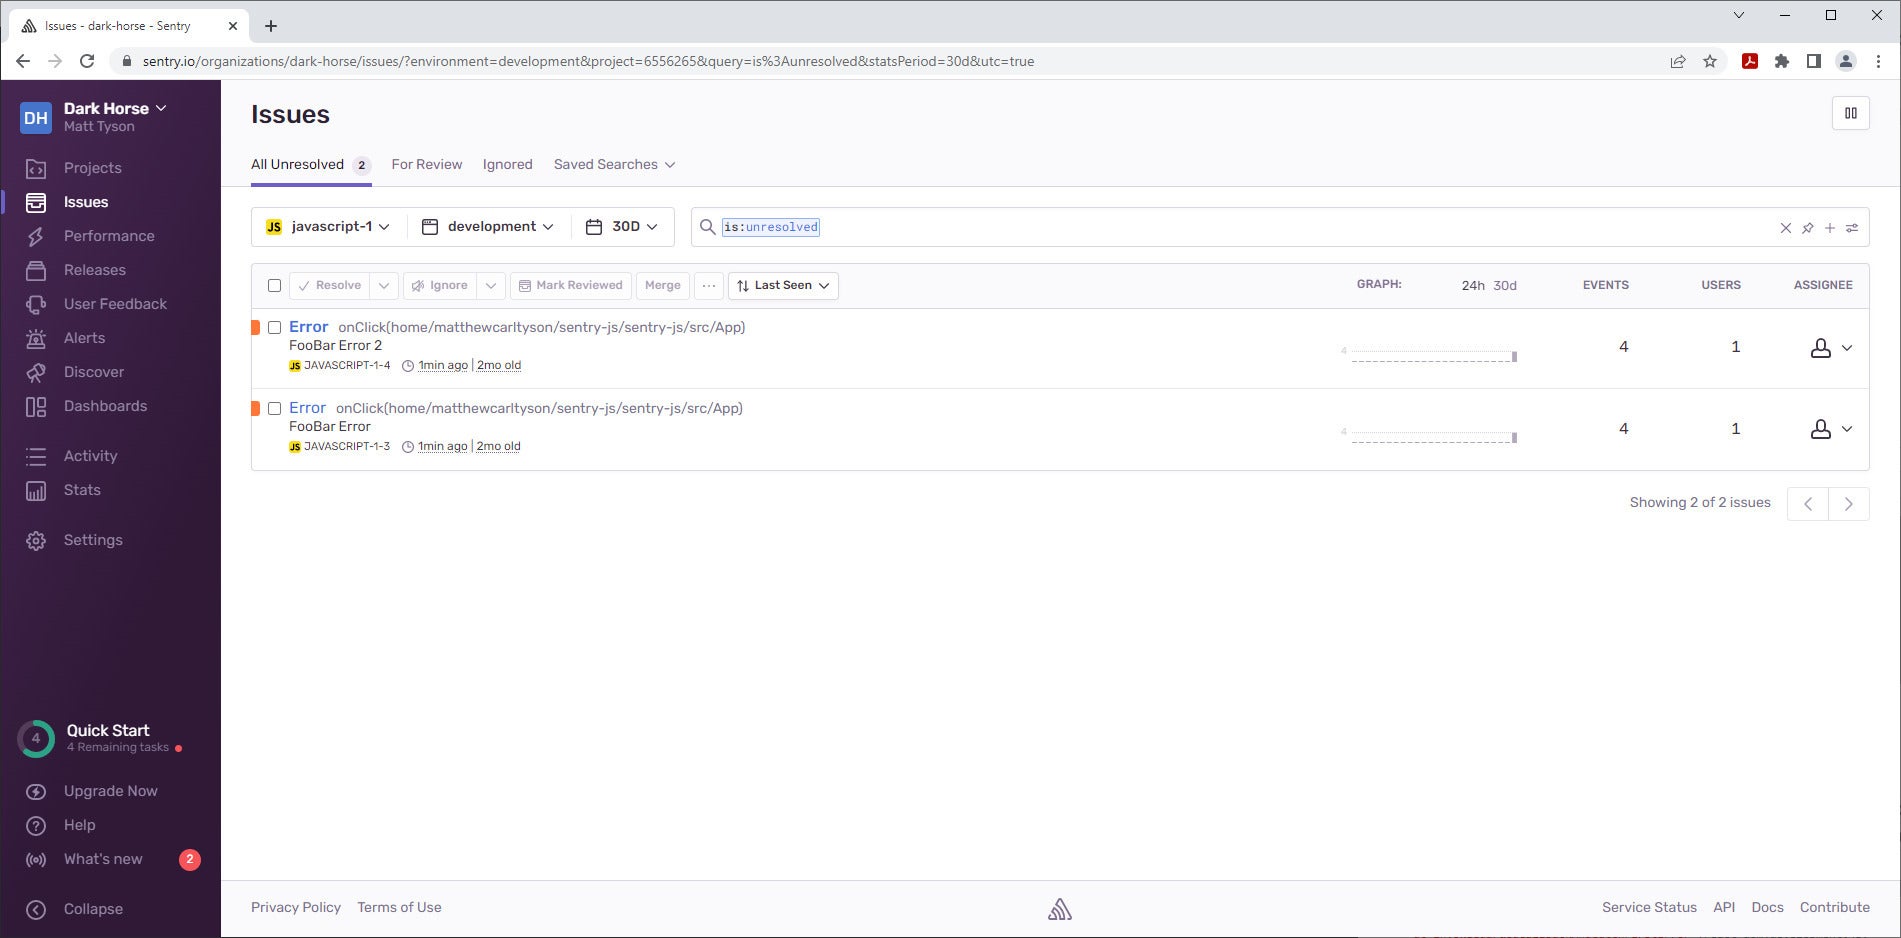
Return to the Sentry dashboard and click the Issues link on the left-hand navigation bar. You’ll see a screen similar to Figure 2.
 IDG
IDG
Figure 2. Issues screen in the Sentry dashboard.
Notice that the error is shown here with some details, including where the error was called from (in my case, onClick(home/matthewcarltyson/sentry-js/sentry-js/src/App)) and the error message FooBar Error. Sentry is already capturing useful information.
If you click the button repeatedly, you’ll notice that the error count does not rise. Sentry recognizes similar events, such as an instance of an error occurring, and groups them together as a single issue.
Performance monitoring with Sentry
You can see transactions by clicking on Performance in Sentry's navigation menu.
Transactions work in tandem with error monitoring, providing a way to not only monitor for errors but also identify performance issues. A simple example would be identifying slow API fetch requests in your application, versus exceptions that were thrown.
You’ll see some panes charting transaction metrics. At the bottom of the screen, is a table with transactions, including / transaction. That is the result of hitting the root of the application. If you click on the slash, you’ll open the transaction details, and Sentry will give you metrics on the various assets that were loaded by this page, like how long it took to load the favicon.
Set and filter by environment
Sentry automatically assigns issues and transactions to the production environment if you don’t tell it what environment the reports are coming from. You can see this in the Issues table, where the header dropdown All Env shows Production when clicked.
You can set the environment explicitly by adding an environment field in the Sentry initialization (/src/index.js in this case). An example would be: environment: development. Once transactions have arrived with that in place, you can sort and filter by the environment.
In your builds, you can set the environment field to have the appropriate value via environment value with a tool like dotenv.
Releases
With Sentry, you can also view and organize data via releases. Click the Releases link in the navigation menu to get started. In the All Project dropdown, select the project you created earlier. This will open a dialog for creating a release. Click the <click-here-for-your-token> link and select Create new integration. The resulting dialog asks for a name for your new integration, which is an association between a deployment and a project. You can accept the default, which in my case is javascript-1 Release Integration.
The configuration screen will now be populated with the release ID. Before we can do anything else, we’ll need a Git commit for Sentry to attach to. So, init a new repo with the steps show in Listing 3 (note that Git must be installed):
Listing 3. Init local repo
git init
git add .
git commit -m “initial”
We can now follow steps similar to those provided in the Sentry Releases screen, as shown in Listing 4.
Listing 4. Create a release
# Installs the sentry command line tool:
curl -sL https://sentry.io/get-cli/ | SENTRY_CLI_VERSION="2.2.0" bash
# Sets env variables
SENTRY_AUTH_TOKEN=
VERSION=`sentry-cli releases propose-version`
# use the tool to create a release
sentry-cli releases new "$VERSION" --org=dark-horse --project=javascript-1 --auth-token=<YOUR-INTEGRATION-ID-HERE>

# Associate the git commit
sentry-cli releases set-commits "$VERSION" --auto --org=dark-horse --project=javascript-1 --auth-token=<YOUR-INTEGRATION-ID-HERE>

#
sentry-cli releases finalize "$VERSION" --org=dark-horse --project=javascript-1 --auth-token=<YOUR-INTEGRATION-ID-HERE>
Now, when you return to the Sentry console and select Releases on the left, you’ll see the newly created release. You can see it has correctly placed the javascript-1 project. If you click into the release itself, you will see metrics and details about it.
We can use releases to track errors and performance as part of your release cycles. You can track what release an issue was introduced in, follow regressions, and so on. You can also directly associate releases to commits in a repository like GitHub.
Conclusion
We have just scratched the surface of what we can do with Sentry. It can be used for integrating with issue tracking systems, assigning issues to people and teams, tracking issues, and incorporating fine-grained performance metrics.
Every project of sufficient size and complexity merits error and performance tracking. It’s not hard to see why Sentry is a leader in this space, as it makes it easy to manage the data generated and gain visibility into it. Sentry's sophisticated yet low-effort integration makes it simple to add to a project. You've seen that here with our example based on React.