


Not long ago, I showed you how to add tracing to a JavaScript application with Sentry. In this article, we’ll walk through using Sentry on the back end to track errors in a Python-Django application stack.
Install and set up Python and Django
The first step is to create a Django application. We’re going to use Python 3, so start by installing Python 3 on your system. We’ll also need pip3. On Debian, I install them both by entering the command, sudo apt-get install python3 python3-pip. Once you have Python and pip installed you should get responses from the -V switch, as shown in Listing 1.
Listing 1. Make sure python3 and pip3 are available
$python3 -V
Python 3.11.0
$ pip3 -V
pip 22.3.1 from /usr/lib/python3/dist-packages/pip (python 3.11)
Next, install the Django framework and verify it is working, as shown in Listing 2.
Listing 2. Install Django
$ pip3 install Django
…
$ django-admin --version
4.1.3
Now we can start a new application using Django. Enter the command, django-admin startproject djangosentry. This creates a directory to hold our starter project. Now, CD into the project, /djangosentry. Django manages the application database, so we just need to fill it with the initial data needed for running a Django type. Enter, python3 manage.py migrate, where manage.py is the main Django script. After that completes, we'll add a user by entering: python3 manage.py createsuperuser. We will need this user to log in. (Note that you will be prompted for a username and password—just use something you will remember.)
We need to tell Django to allow the current host. You can find out your IP address by pointing your browser to https://whatsmyip.com. Go to djangosentry/setting.py and add the IP address where the instance is located to the ALLOWED_HOSTS array; something like: ALLOWED_HOSTS = ['192.168.0.122']. Now, you can start the server by typing: python3 manage.py runserver 0.0.0.0:8000.
If you visit http://192.168.0.122:8000, you will see the Django welcome screen shown in Figure 1.
 IDG
IDG
Figure 1. The Django welcome screen.
Note that there is also an admin console to add users and groups at http://192.168.0.122:8000/admin.
Set up Sentry
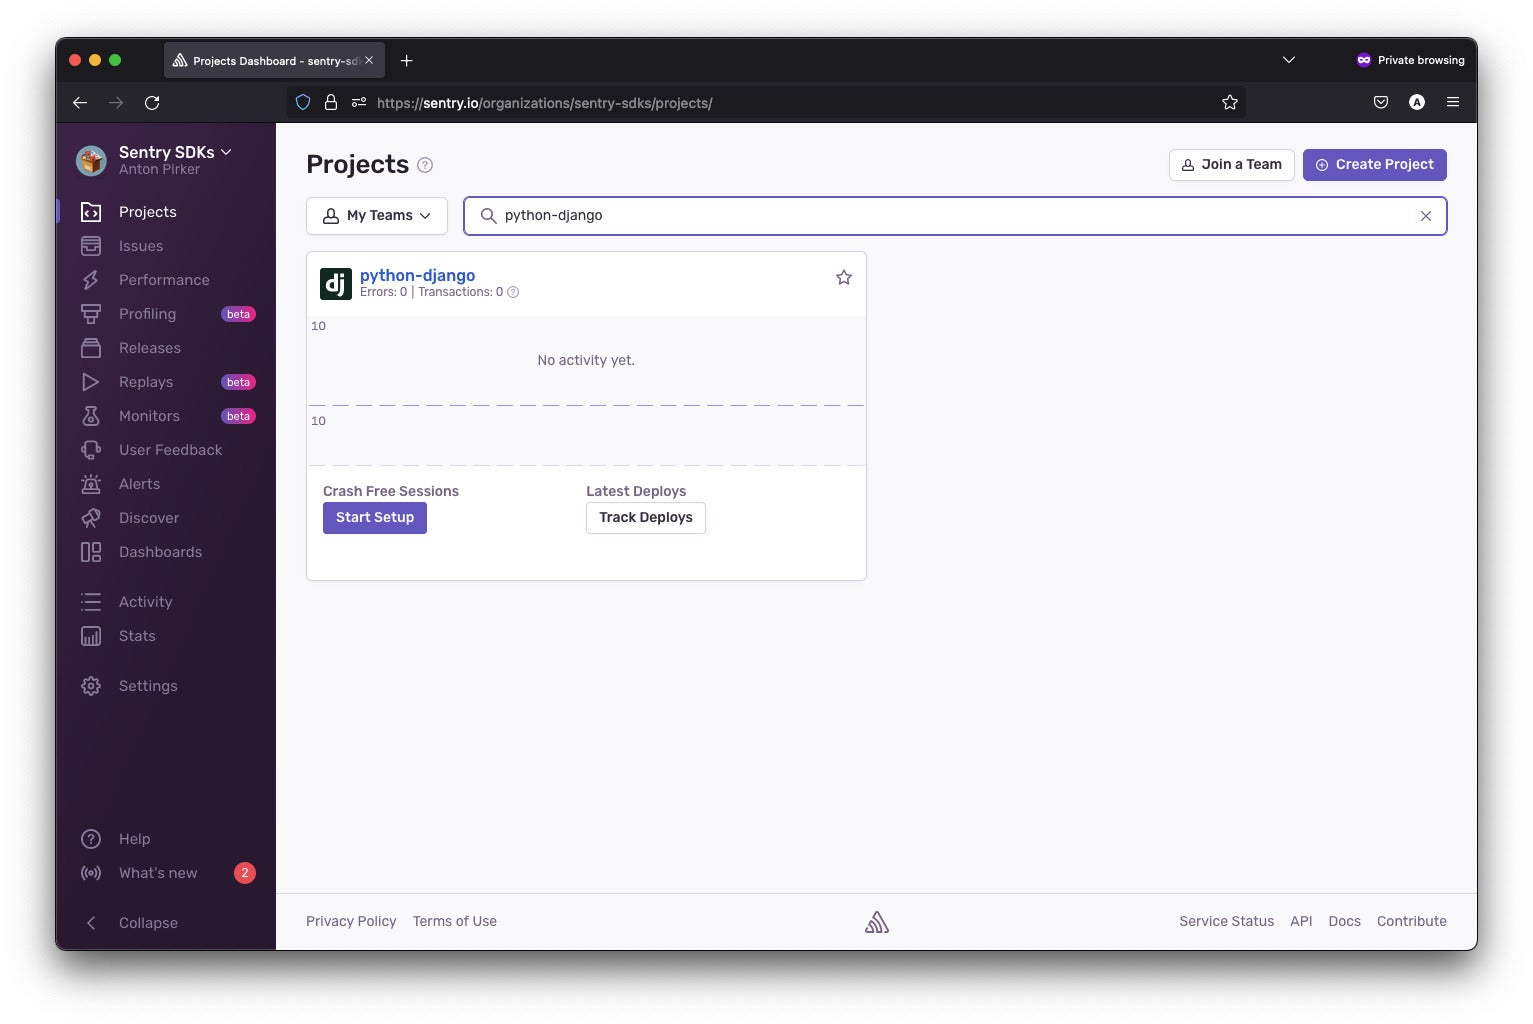
Now that we have a running Django application, let’s set up Sentry to track errors. The first step is to create a Sentry account, which is free if you select the Developer option. After you have an account and log in, you’ll see the Sentry dashboard. The left-hand menu presents the main navigation for Sentry. Click on Projects and create a project with the Create Project button in the upper-right corner.
 IDG
IDG
Figure 2. Create a new project.
Create and configure a Django project
A project gives us a central container for our tracing info. After you hit Create Project, you can select “Django” as the type and accept the default name of django-python.
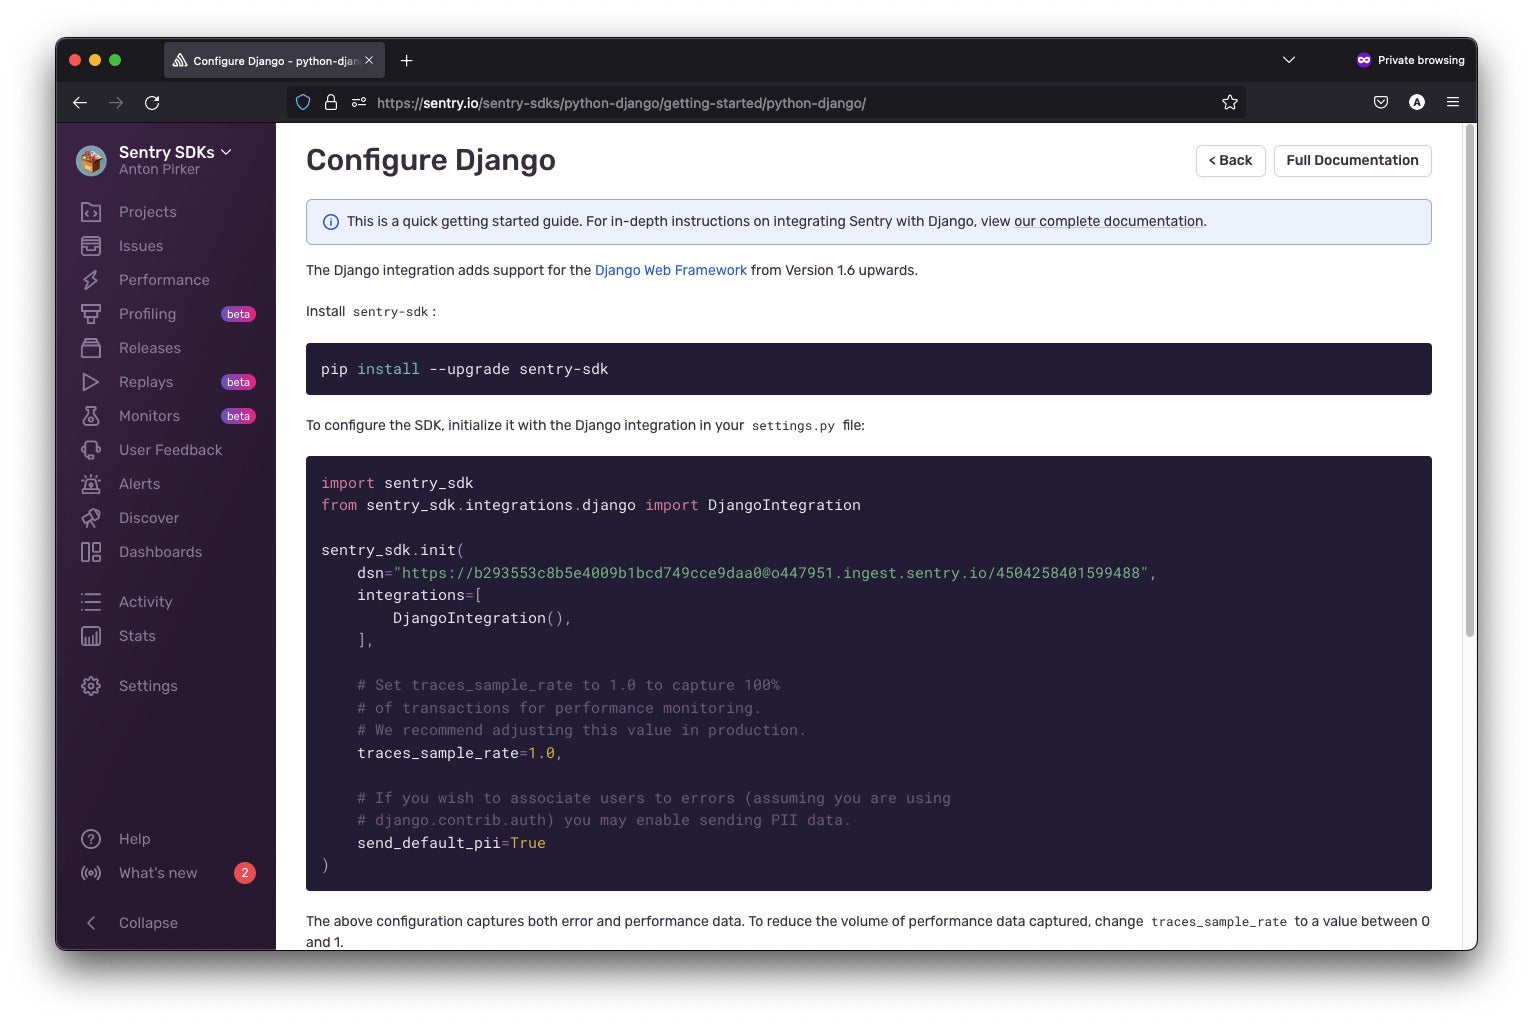
After the project is created, you will be presented with the option to configure it. Copy the code snippet shown in Figure 3 and add it to your project.
 IDG
IDG
Figure 3. Configure Django.
Now that we have an application and a project, we can add the Sentry library. Return to the djangosentry project on your command line and type: pip install --upgrade sentry-sdk. This command adds the Sentry library to your project.
Now, we’ll import and configure the SDK into our djangosentry/settings.py file, which is the main configuration file for Django. This is just a few lines of code, but we need the data source name (DSN) for the project. The idea here is that the DSN will create the association between the Django project and the project in Sentry, so you can track project activity using the dashboard.
Now go to the djangosentry/djangosentry/settings.py file and add the code you copied to the bottom of the file. The result should look like what you see in Listing 3.
Listing 3. Add Sentry SDK and project DSN to settings.py
import sentry_sdk
from sentry_sdk.integrations.django import DjangoIntegration

sentry_sdk.init(
    dsn="<THE DSN YOU COPIED>",
    integrations=[
    DjangoIntegration(),

    ],
    traces_sample_rate=1.0,
    send_default_pii=True
)
Believe it or not, the Django project is ready to capture error data. In fact, the traces_sample_rate setting tells Sentry to also capture performance metrics—this value can be anywhere from 0 to 1.0. Note that setting your sample rate to 100% (that is, 1.0) can quickly exhaust your quota. Be sure to adjust your sample rate after collecting the initial performance data.
Error reporting with Sentry
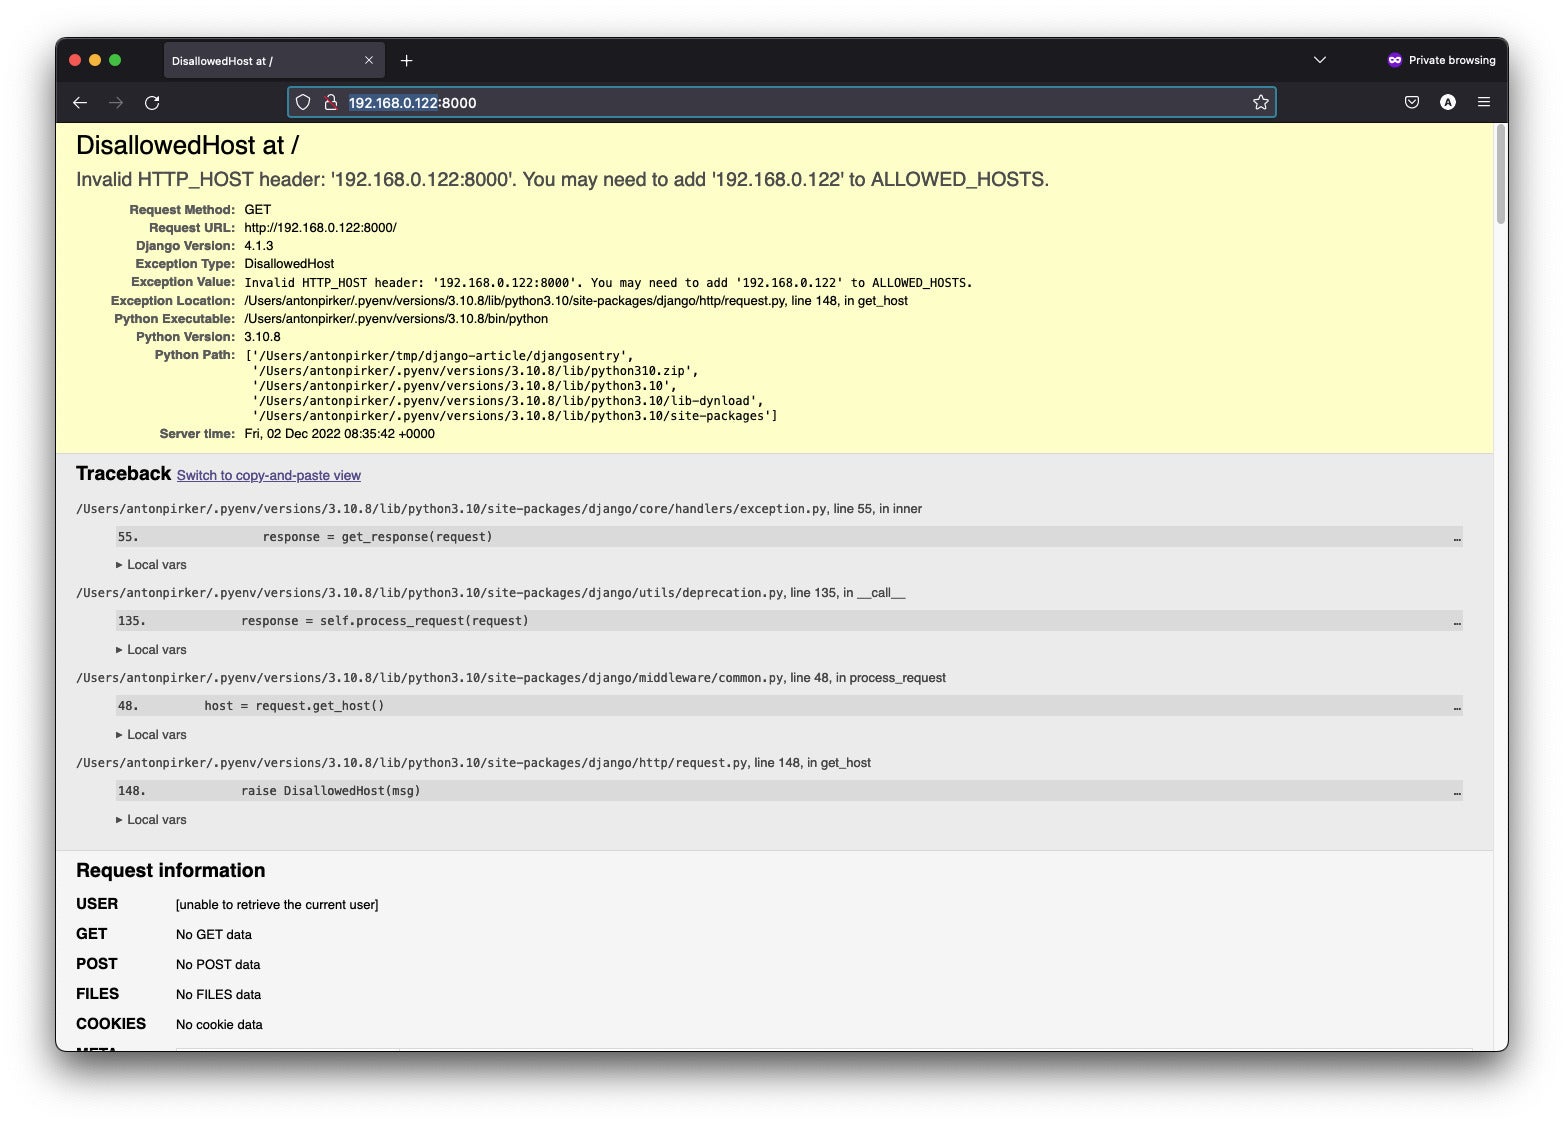
Let’s create a quick error to see if Sentry is working. Go back into your settings.py file and remove the IP address from the allowed hosts. Then, restart the application and reload the webpage. You’ll get an error page like the one in Figure 4.
 IDG
IDG
Figure 4. An error in Django.
If you check the Django console output you’ll also find the error: [20/Nov/2022 11:17:40] "GET / HTTP/1.1" 400 69108. The Django server is returning an HTTP permission error 400.
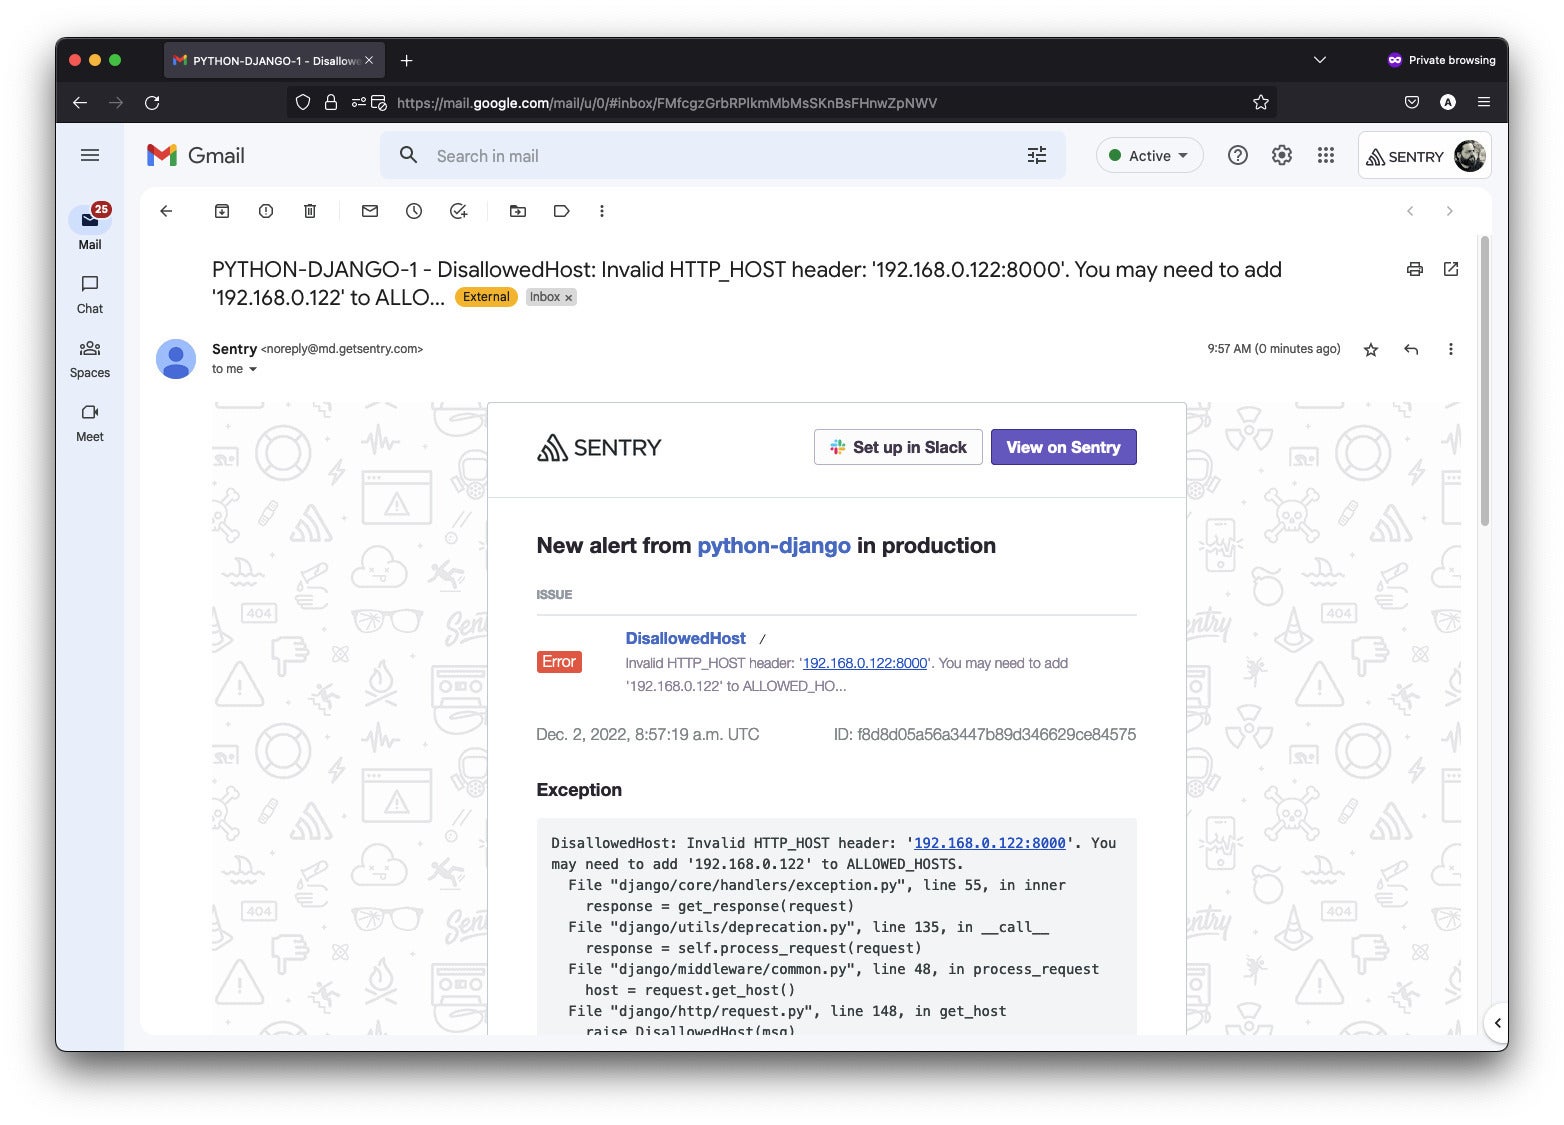
Now, let's look at the same error report from Sentry. By default, the email address you used to set up your Sentry account is subscribed to alerts. For the HTTP permission error, you will receive an alert similar to what you see in Figure 5.
 IDG
IDG
Figure 5. An email alert from Sentry.
Next, take a look at the Sentry dashboard. If you open the python-django project you’ll see the error reflected there, as shown in Figure 6.
 IDG
IDG
Figure 6. The Django error in your Sentry dashboard.
You can click on the error in the dashboard to get details. You will see pretty much everything the system could know about what happened, from the user agent and timestamp to whether it was a handled exception (in this case, it was).
Configuring the environment
Notice that the error in Figure 6 is tagged as environment: production. Lacking further configuration, Sentry assumed the error came from production. To manually set the environment, go to the djangosentry/settings.py file. In the sentry_sdk.init() function call, add an argument specifying an environment, as shown in Listing 4.
Listing 4. Adding an environment
sentry_sdk.init(
    dsn=”https://5a494c21efc04030af81283b5a98b9f0@o1307092.ingest.sentry.io/4504193108672512”,
    	integrations=[
        	DjangoIntegration(),
   	],
   	 traces_sample_rate=1.0,
    	send_default_pii=True,
    	environment="dev" # < ADD THIS
)
Now, when an error is reported, Sentry will assign it to the dev environment. You could set this string from an environment variable (for example called SENTRY_ENVIRONMENT). On your server, you set this variable as production, staging, or qa. On your local machine, set the variable to dev. You can then select from the dropdown list and filter by the environment in the dashboard.
Coding errors and issue tracking
Instead of crashing the example application, let’s first fix the ALLOWED_HOSTS entry by putting the correct IP address back in there. Then, let's create a typical coding error by adding a Django route that spews an exception. Open the djangosentry/urls.py file and modify it to include the /error path, as shown in Listing 5.
Listing 5. Add an error path to urls.py
def trigger_error(request):
    raise Exception("Something has gone seriously wrong and you're coding skills are in question.")

urlpatterns = [
    path('admin/', admin.site.urls),
    path('error/', trigger_error)
]
Now, if you visit the localhost:8000/error route you’ll see the custom exception. You’ll notice that Sentry has by default grouped similar errors into issues. The new exception has triggered an alert email, but repeatedly causing the same error does not. You can see the same kind of organization on the Sentry dashboard, as shown in Figure 7.
By default, similar errors (or events) are grouped into issues. This is configurable and you can organize several events into a single issue.
 IDG
IDG
Figure 7. Errors grouped into issues.
Performance monitoring
Now that you have set up Sentry to track and report errors, you can set it up to also capture performance metrics to quickly identify latency and throughput issues.
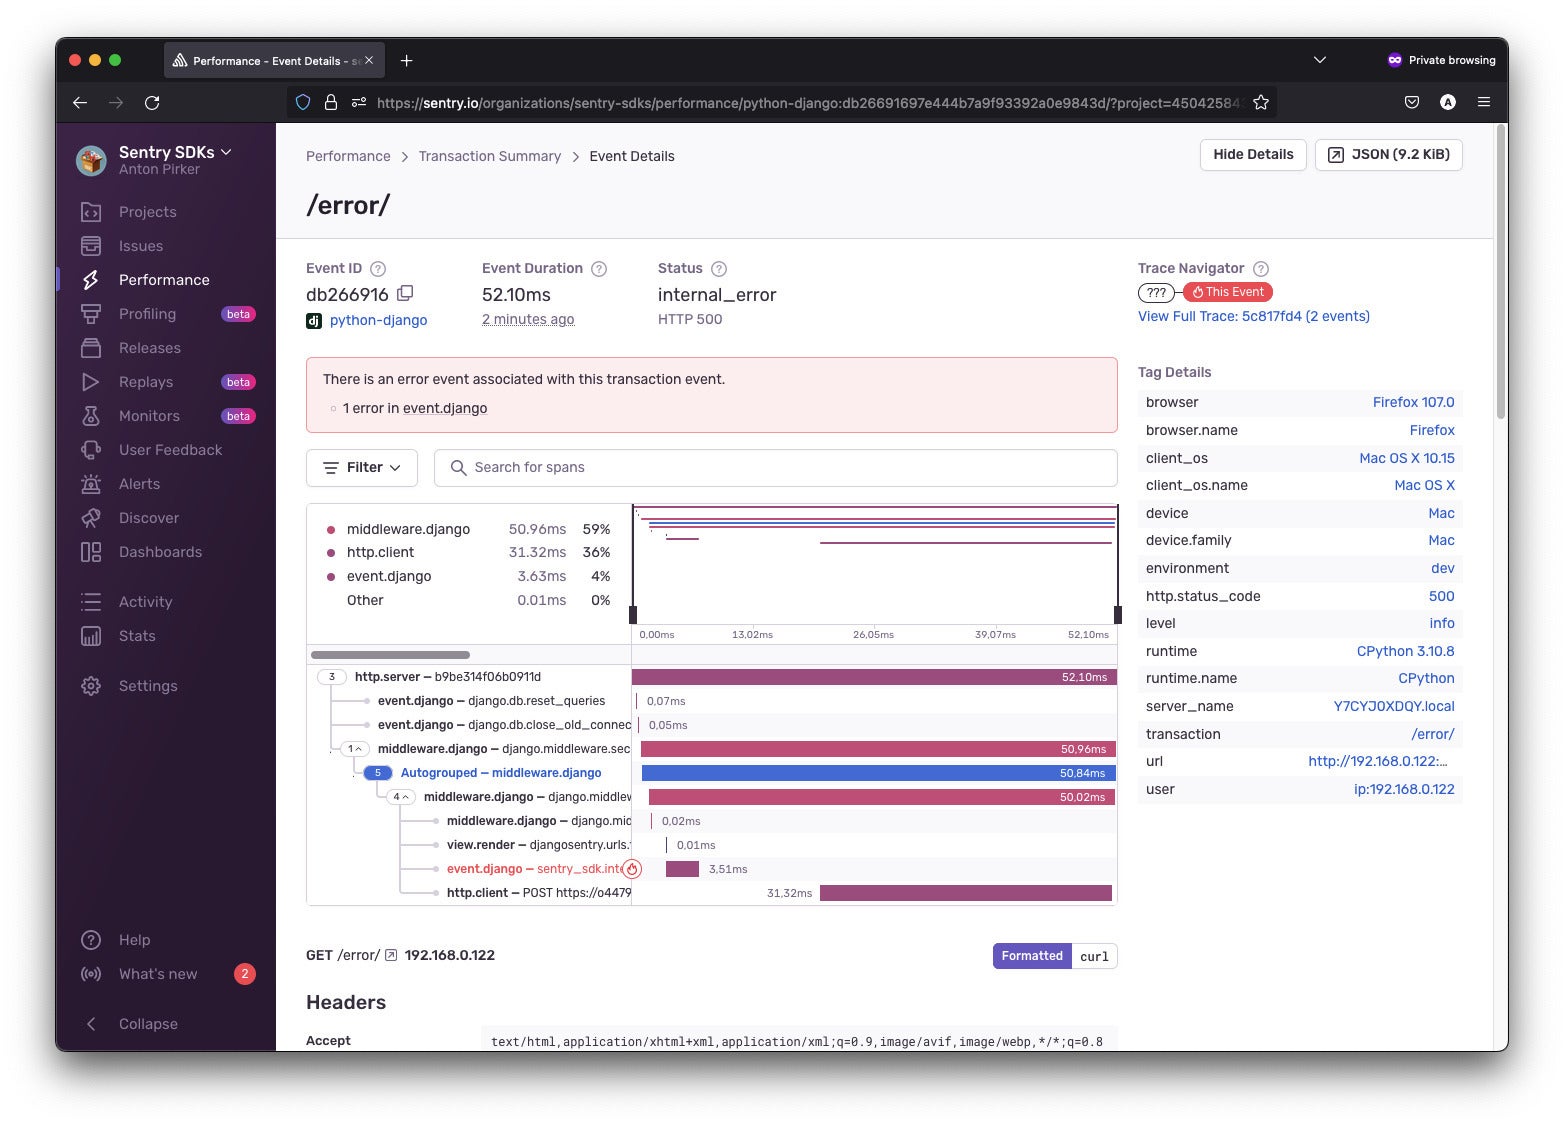 IDG
IDG
Figure 8. Performance metrics in Sentry.
Here, you can see the performance breakdown of the error path you added earlier. Sentry recently added a new feature to detect common performance problems to its application performance monitoring platform. N+1 database queries for Django projects are the first problem type that Sentry introduced for the new Performance Issues feature. As described in this tweet, the team that created Django used the new feature to detect an N+1 issue on Django’s documentation site. Django Fellow Carlton Gibson commented: “It was nice to see the N+1 queries pop-up in the Sentry issues list. A quick select_related and all was resolved, as it was easy to miss where these [N+1 queries] come up. I think it’s going to be quite handy."
Conclusion
We've done a quick tour of some of Sentry’s capabilities in a Python-Django application context. There is quite a lot of power under the hood on Sentry’s dashboard, but perhaps the nicest thing of all is how easily you can use it to add error tracking to an application. All we had to do was obtain our DSN, make a small code change, and errors were being reported across the application with reasonable, configurable defaults.