


Of the three pillars of observability, traces have historically lagged behind logs and metrics in usage. We’re hoping to change that with Grafana Tempo, an easy-to-operate, high-scale, and cost-effective distributed tracing back end.
Tempo allows users to scale tracing as far as possible with less operational cost and complexity than ever before. Tempo’s only dependency is object storage, and it supports search solely via trace ID. Unlike other tracing back ends, Tempo can hit massive scale without a difficult-to-manage Elasticsearch or Cassandra cluster.
We launched this open source project in October 2020, and just seven months later, we’re excited to announce that Tempo has reached GA with v1.0.
In the past months we have primarily been focused on stability, horizontally sharding the query path, and performance improvements to increase scale. We have also notably added compression to the back-end traces and write-ahead log, which reduces local disk I/O and total storage required to handle your traces.
In this article, we’ll walk through an overview of distributed tracing, and what Tempo brings to the table.
Why distributed tracing?
While metrics and logs can work together to pinpoint a problem, they both lack important elements. Metrics are good for aggregations but lack fine-grained information. Logs are good at revealing what happened sequentially in an application, or maybe even across applications, but they don’t show how a single request possibly behaves inside of a service. Logs will tell us why a service is having issues, but maybe not why a given request is having issues.
This is where tracing comes in. Distributed tracing is a way to track and log a single request as it crosses through all of the services in your infrastructure.
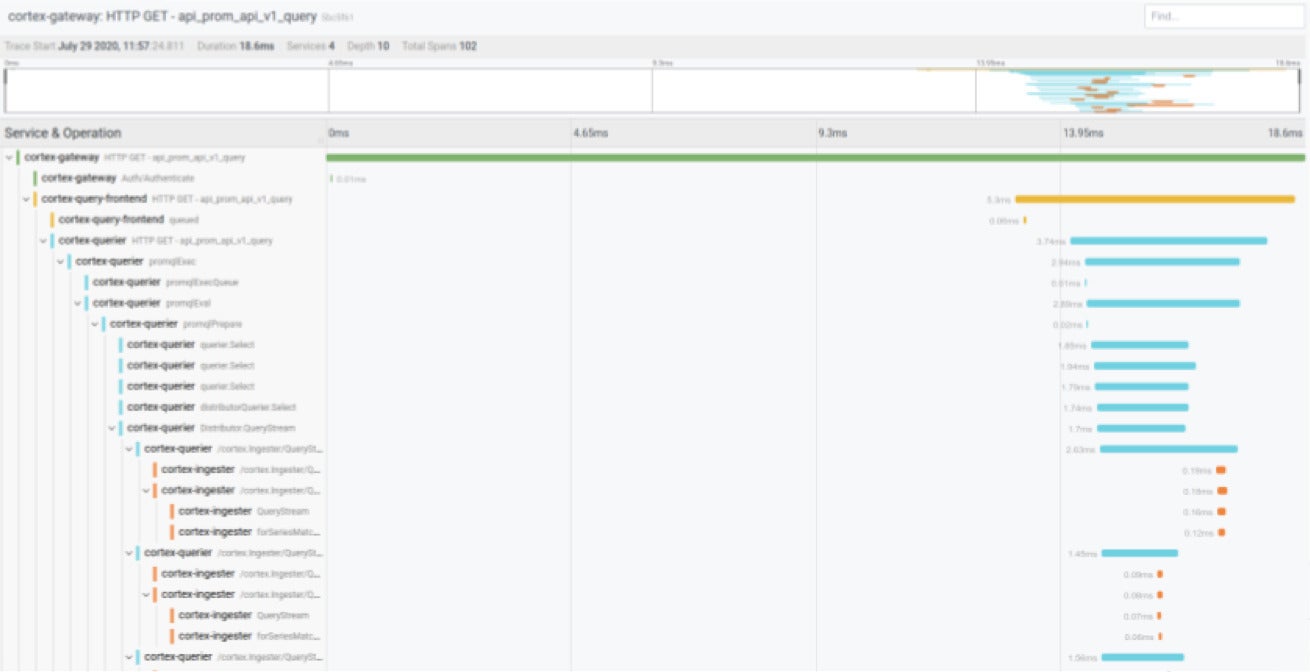 Grafana Labs
The screen image above shows a Prometheus query that is passed down through four different services in about 18 milliseconds. There is a lot of detail about how the request is handled. If this request took 10 seconds, then the trace could tell us exactly where it spent those 10 seconds—and perhaps why it spent time in certain areas—to help us understand what’s going on in an infrastructure or how to fix a problem.
In tracing, spans are representations of units of work in a given application, and they are represented by all of the horizontal bars in the query above. If we made a query to a back end, to a database, or to a caching server, we could wrap those in spans to get information about how long each of those pieces took.
Spans are related to each other in a handful of different ways, but primarily by a parent-child relationship. So in the query above, there are two related spans in which promqlEval is the parent and promqlPrepare is a child. This relationship is how our tracing back end is able to take all these spans, rebuild them into a single trace, and return that trace when we ask for it.
Why Grafana Tempo?
At Grafana Labs, we were frustrated with our down-sampled distributed tracing system. Finding a sample trace was generally not difficult, but our engineers often wanted to find a specific trace.
We wanted our tracing system to be able to always answer questions like, “Why was this customer’s query slow?” Or “An intermittent bug showed up again. Can I see the exact trace?”
We decided we wanted 100% sampling, but we didn’t want to manage the Elasticsearch or Cassandra cluster required to pull it off.
Then we realized that our tracing back end didn’t need to index our traces. We could discover traces through logs and exemplars. Why pay to index your traces and your logs and your metrics? All we needed was a way to store traces by ID. And that’s why we created Tempo.
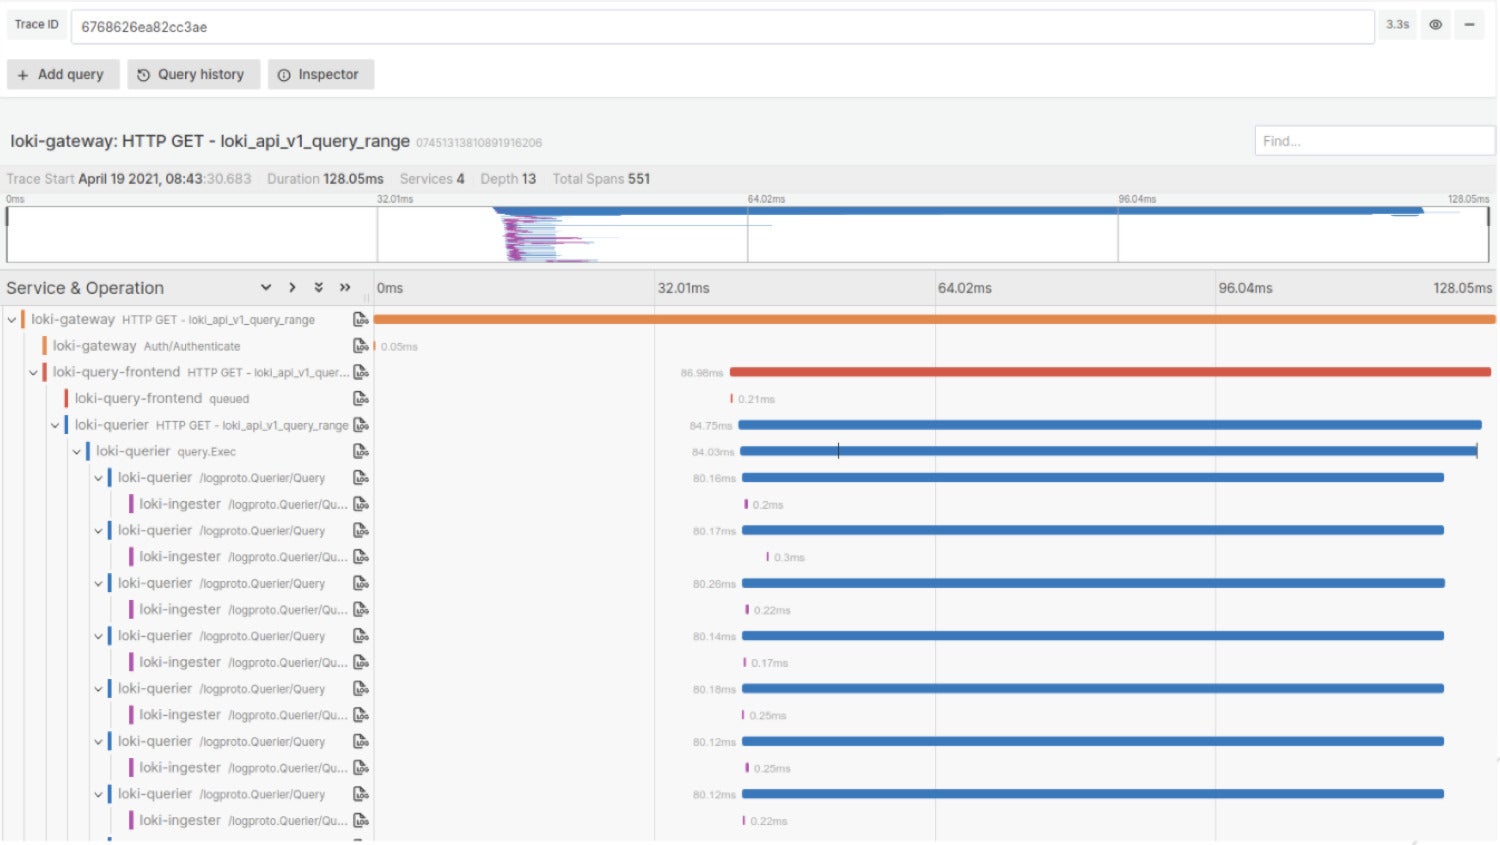 Grafana Labs
Tempo is used to ingest and store the entire read path of Grafana Labs’ production, staging, and development environments. Currently we are ingesting 2.2 million spans per second and storing 132TB of compressed trace data totaling 74 billion traces. Our p50 to retrieve a trace is ~2.2 seconds.
Correlations between metrics, logs, and traces
With Tempo, the vision for more correlations between metrics, logs, and traces is becoming a reality.
Linking from logs to traces
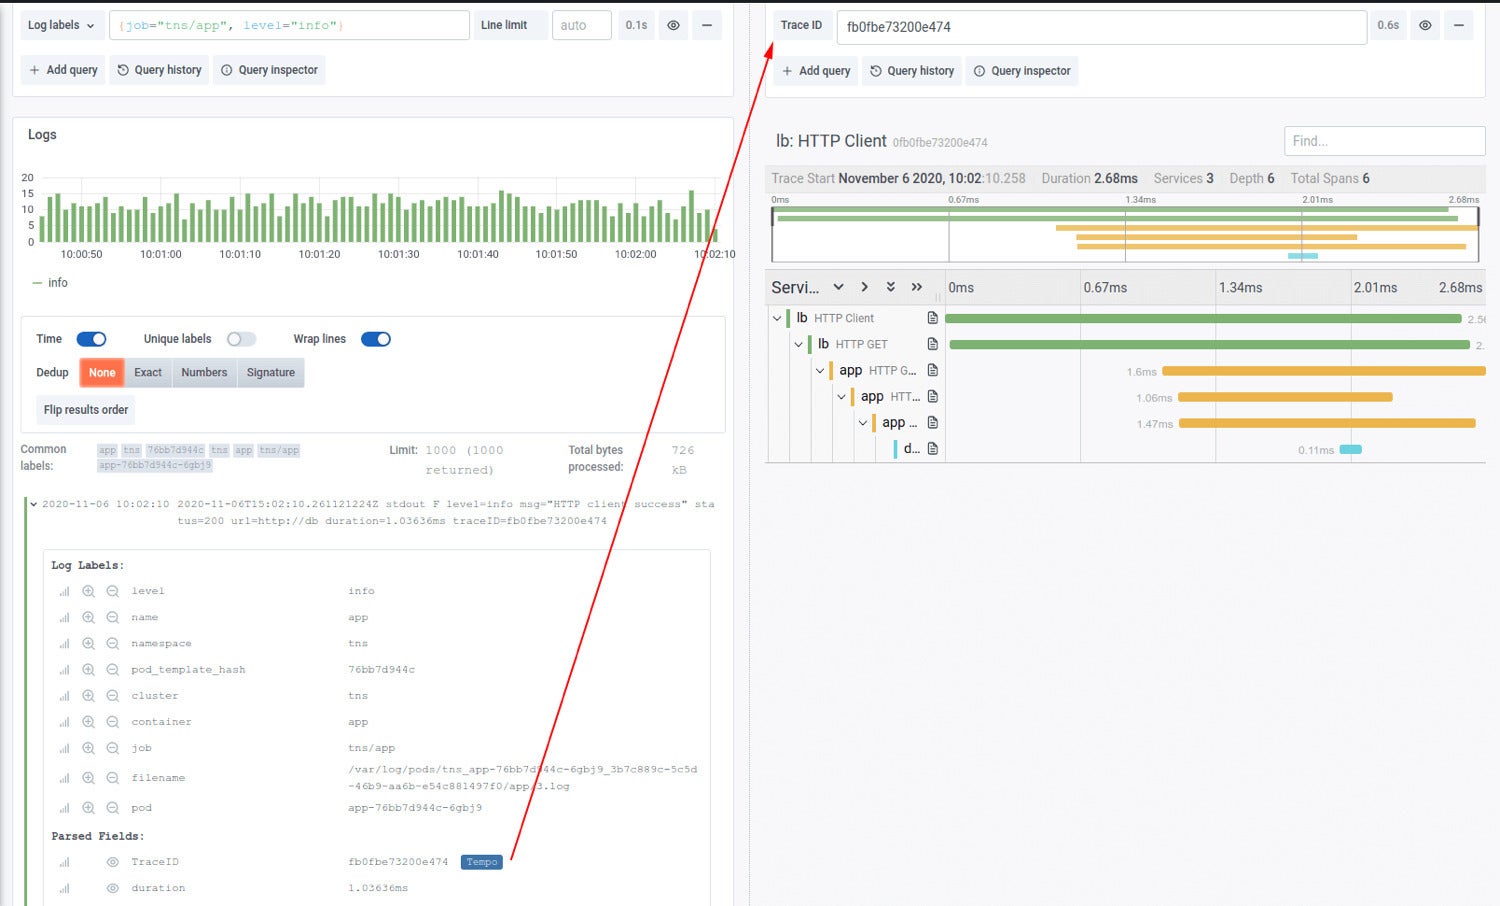
Loki and other log data sources can be configured to create links from trace IDs in log lines. Using logs, you can search by path, status code, latency, user, IP address, or anything else you can stuff onto the same log line as a trace ID.
Consider a line such as:
path=/api/v1/users status=500 latency=25ms traceid=598083459f85afab userid=4928
All of these fields now provide a searchable index for your trace IDs in Tempo. By indexing our traces with our logs we allow individual teams to customize their indexes into their traces. Each team can log on the same line as trace ID any field that is meaningful to them and it instantly creates a searchable field for traces as well.
As of Loki 2.0, if any log contains an identifier for a trace, you can click on it and jump directly to that trace in Tempo.
 Grafana Labs
Linking from metrics to traces
Using exemplars, traces can now be discovered directly from metrics.
 Grafana Labs
Logs allow you to find the exact trace you’re searching for based on logged fields, while exemplars let you find a trace that exemplifies a pattern. You can have links to traces based on your metrics query directly embedded in your Grafana graph. Call up p99s, 500 error codes, or specific endpoints using a Prometheus query, and all of your traces now become relevant examples of the pattern you’re looking at.
Linking from traces to logs
So exemplars and logs can be used for discovery, and Tempo can be used for storing everything without worrying about the bill. To link from a trace back into logs, the Grafana Agent allows you to decorate your traces, logs, and metrics with consistent metadata, which then creates correlations that were not previously possible. After jumping from an exemplar to a trace, you can now go directly to the logs of the struggling service. The trace immediately identifies what element of your request path caused the error, and the logs help you identify why.
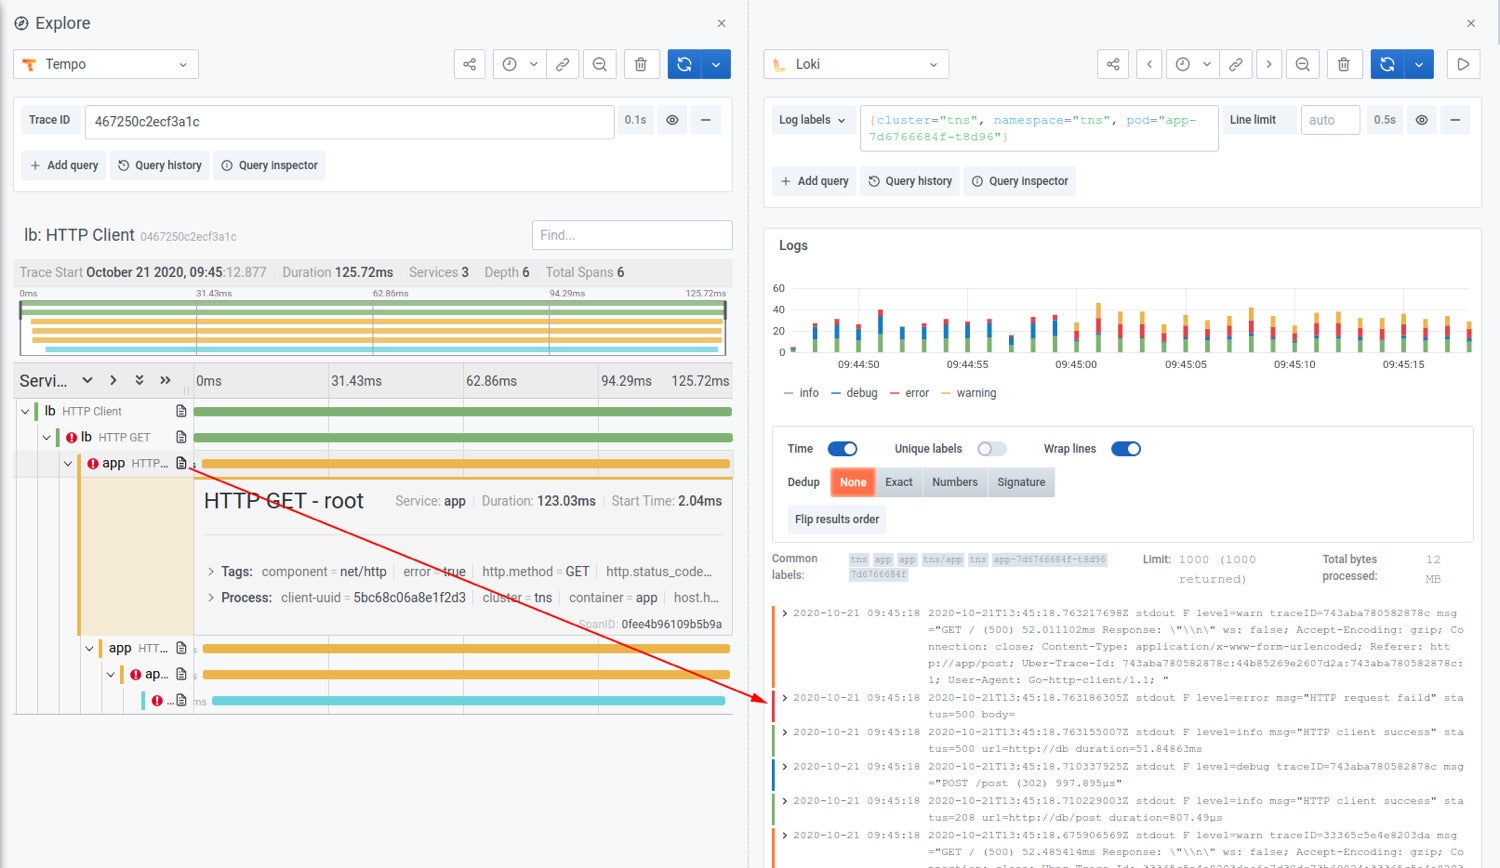 Grafana Labs
Learn more about Grafana Tempo
Join us in the Grafana Slack #tempo channel or the tempo-users Google group, and watch our GrafanaCONline session, “Open source distributed tracing with Grafana Tempo,” for a deeper dive into Tempo. Tempo distributed tracing is also now available as part of the free and paid tiers of our fully managed, composable observability platform, Grafana Cloud; 50 GB of traces are included in the free tier.
Joe Elliott is principal engineer at Grafana Labs.
—
New Tech Forum provides a venue to explore and discuss emerging enterprise technology in unprecedented depth and breadth. The selection is subjective, based on our pick of the technologies we believe to be important and of greatest interest to InfoWorld readers. InfoWorld does not accept marketing collateral for publication and reserves the right to edit all contributed content. Send all inquiries to newtechforum@infoworld.com.