


Improving analytics performance is important. We all understand that, but what’s the best way to ensure that our users are getting the speeds they need without putting a load of extra work on our plate?
As data engineers, we faced this challenge, and so did our friends and colleagues. Our attempt to find a solution would lead us to start the open project StarRocks, an analytics engine that would help us meet rapidly growing analytics performance demands while also being easy to work with and maintain.
As the project and community have grown these last few years, we’ve learned a lot about what works and what doesn’t when it comes to analytics performance. Today, we want to share some insights around one of the key technologies for building a high performance analytics engine: vectorization.
Why vectorization improves database performance
Before we dig into how we approach vectorization with StarRocks, it’s important to clarify that when we talk about vectorization, we’re talking about the vectorization of databases with a modern CPU architecture. With that understanding, we can begin to answer the question: Why can vectorization improve database performance?
To address this question, we first need to answer the following:
- How do you measure CPU performance?
- What factors affect CPU performance?
The answer to the first question can be represented by this formula:
CPU time = (instruction numbers) * CPI * (clock cycle time)
Where
- Instruction numbers = the number of instructions generated by the CPU
- CPI (cycles per instruction) = the CPU cycles needed to execute an instruction
- Clock cycle time = the time elapsed for a CPU clock cycle
This formula gives us some terms we can use to discuss the levers that move performance. Since there is nothing we can do about the clock cycle time, we need to focus on instruction numbers and CPI to improve software performance.
Another important piece of information we also know is that the execution of a CPU instruction can be divided into five steps:
- Fetching
- Decoding
- Execution
- Memory access
- Result write back (into registers)
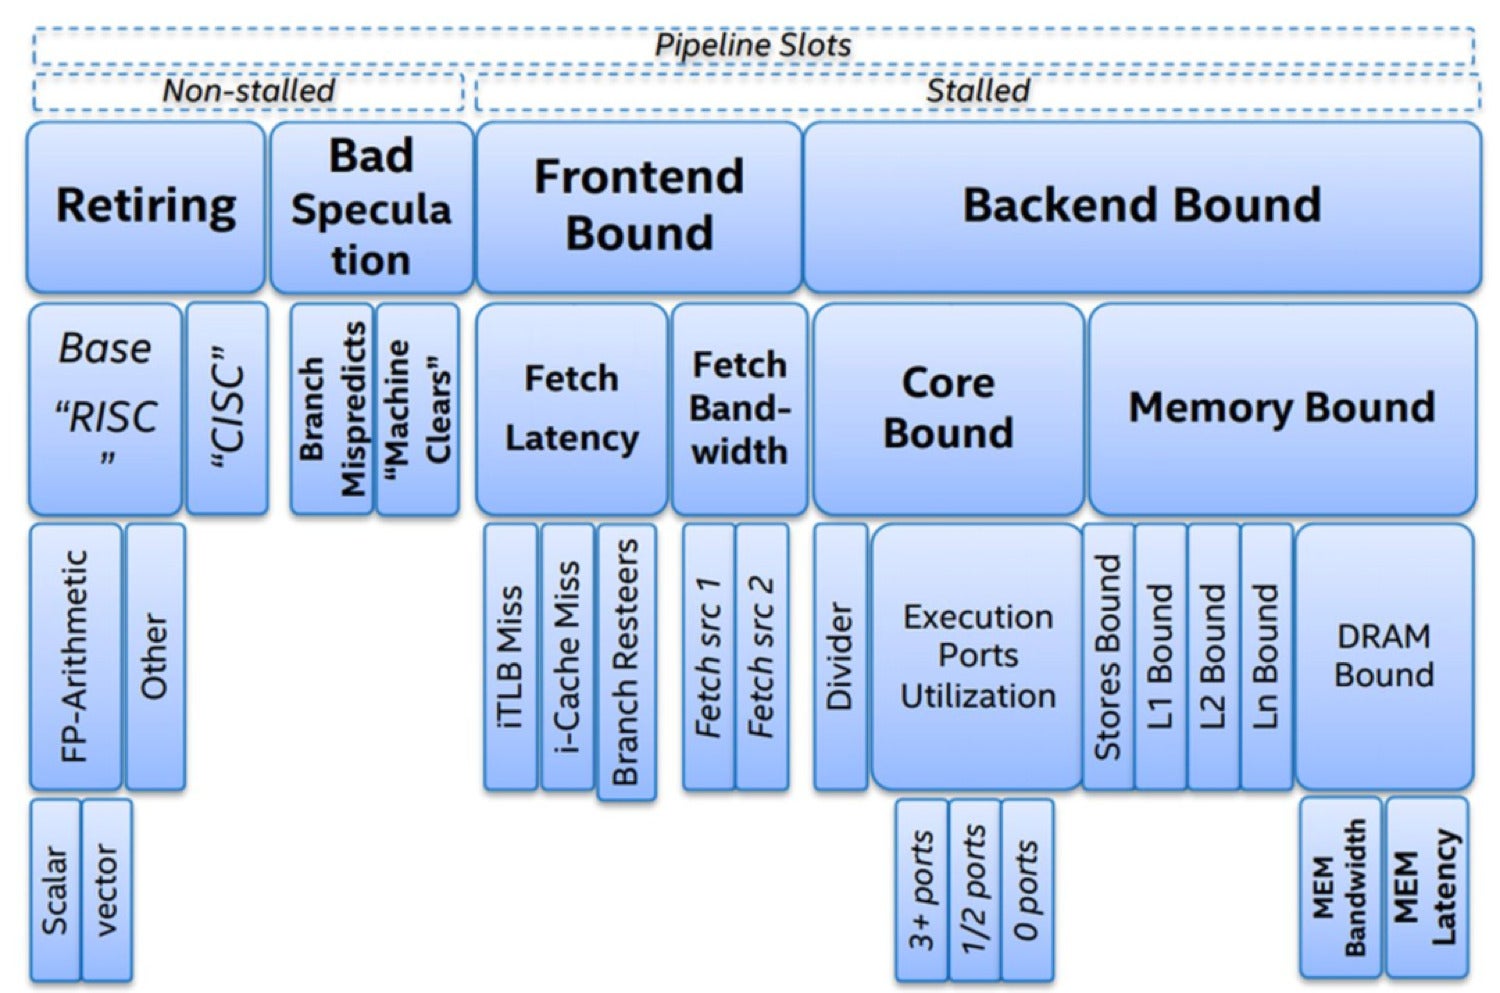
Steps 1 and 2 are carried out by the CPU front end, while steps 3 to 5 are handled by the CPU back end. Intel has published the Top-down Microarchitecture Analysis Method, as illustrated in the following image.
 Intel
Intel
Top-down Microarchitecture Analysis Method (Intel)
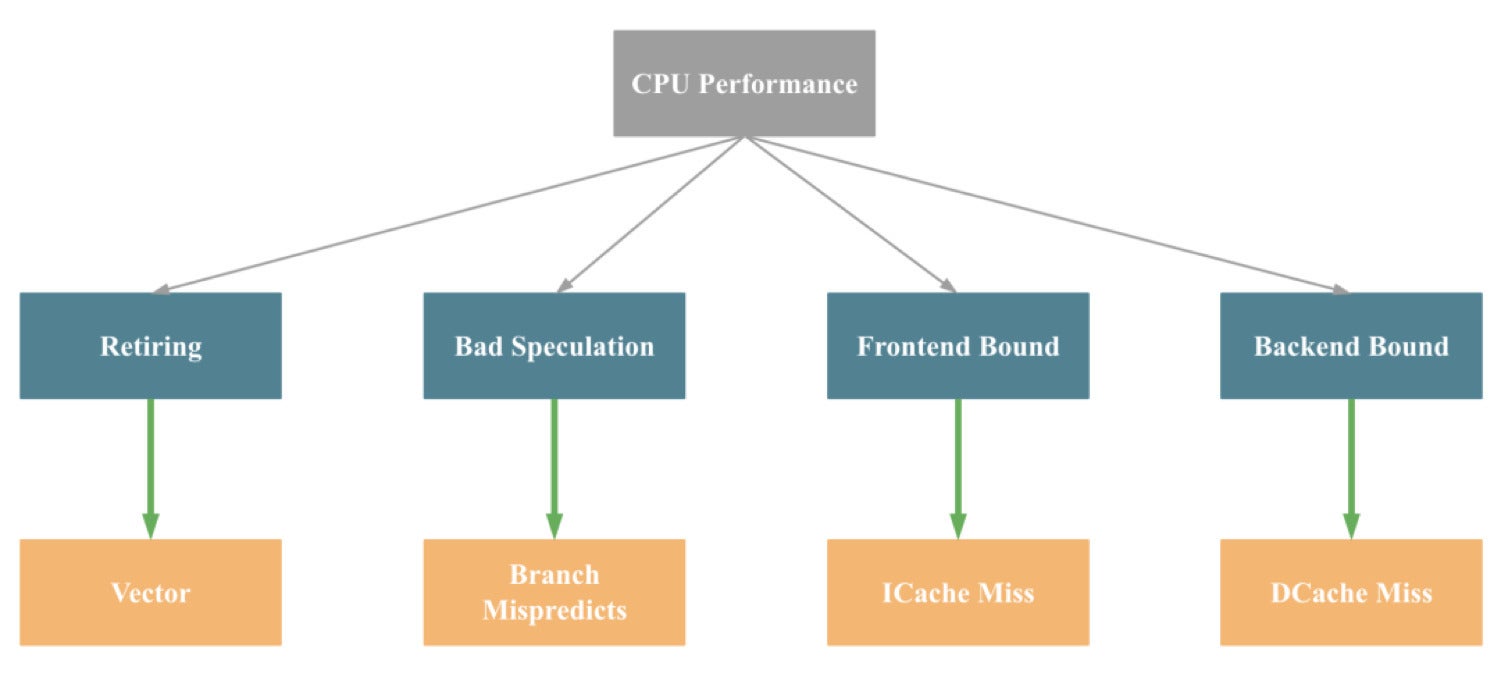
Here’s a more simplified version of the method above.
 CelerData
As you can see, the main contributing factors to CPU performance issues are Retiring, Bad Speculation, Frontend Bound, and Backend Bound.
The main drivers behind these issues, respectively, are a lack of SIMD instruction optimization, branch prediction mistakes, instruction cache misses, and data cache misses.
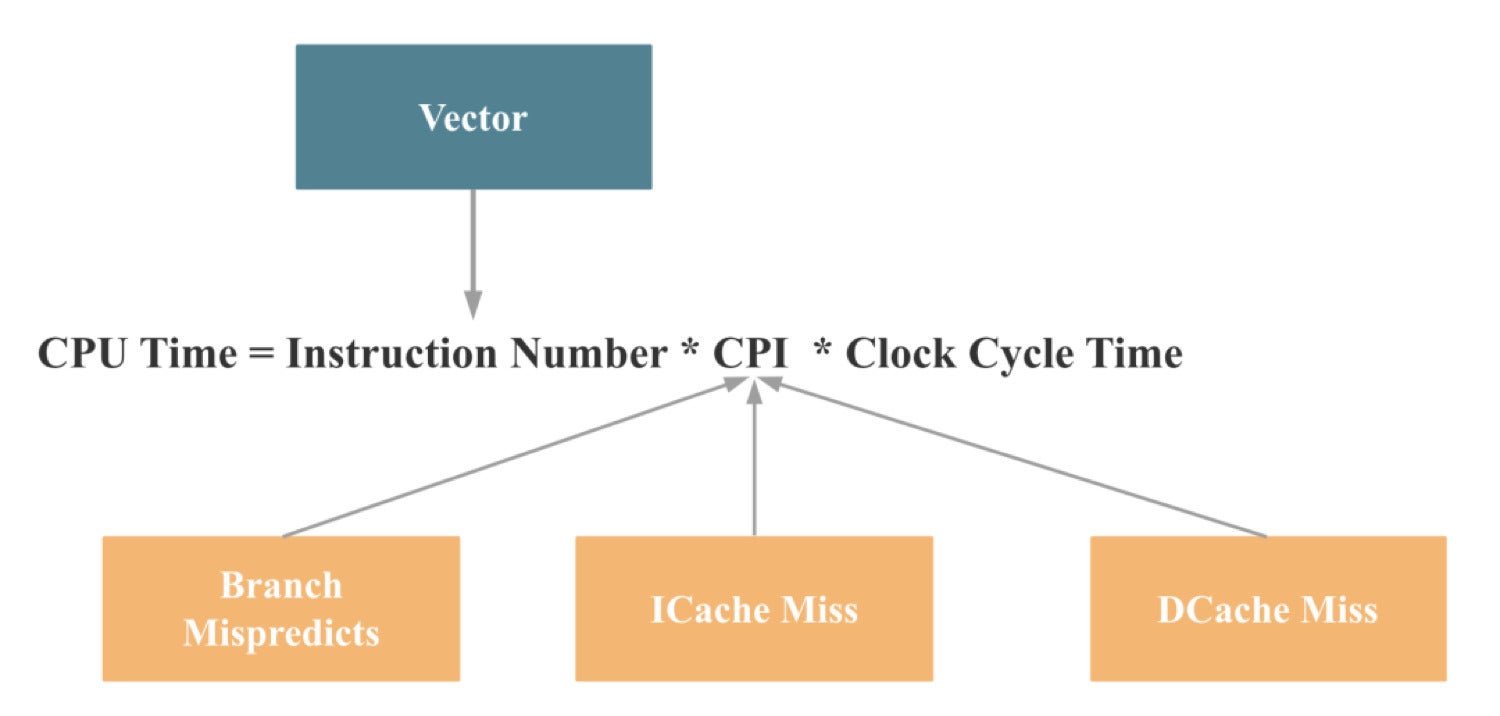
So, if we map the above reasons to the CPU performance formula introduced earlier, we come to the following conclusion:
 CelerData
And what was designed to improve CPU performance in these four areas?
That’s right, vectorization.
We have now established why vectorization can improve database performance. In the rest of this article, we will take a look at how vectorization does it.
The fundamentals of vectorization
If you’ve got a good understanding of vectorization, you can skip this section and move on to the one about database vectorization, but if you’re unfamiliar with the fundamentals of vectorization, or you could use a refresher, we’ll briefly outline what you should know.
Please keep in mind that in this section we will limit our discussion of vectorization to SIMD. SIMD vectorization is different from general database vectorization, which we’ll discuss next.
An introduction to SIMD
SIMD stands for single instruction, multiple data. As the name suggests, with SIMD architecture one instruction can operate on multiple data points simultaneously. This is not the case with a SISD (single instruction, single data) architecture where one instruction operates on a single data point only.
 CelerData
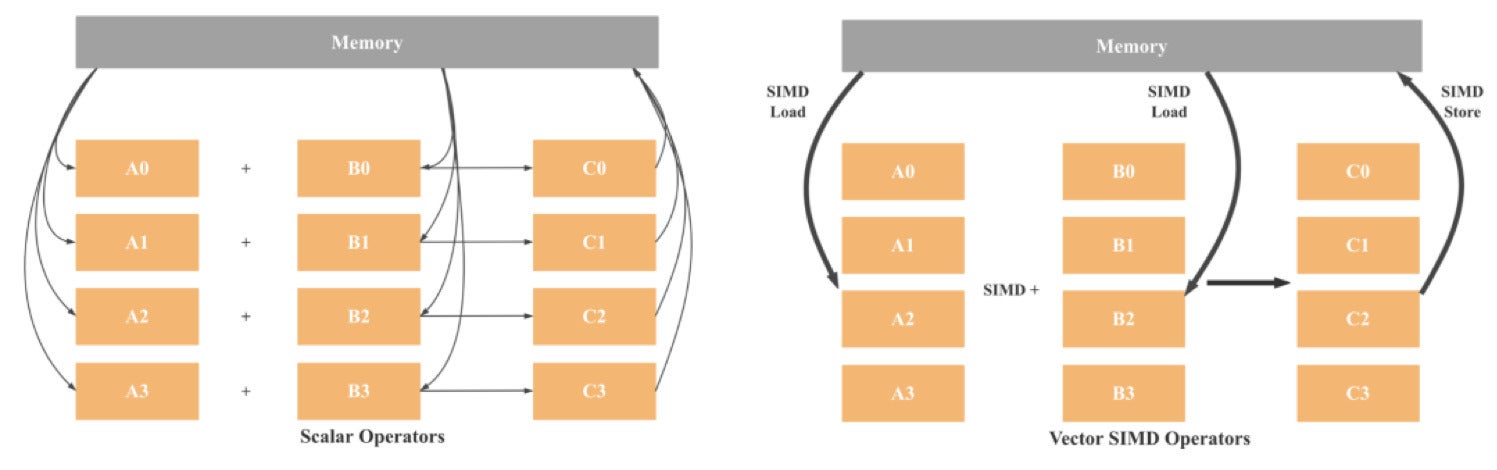
As illustrated above, in SISD architecture, operations are scalar, meaning only one set of data is being processed. Hence, the four additions will involve eight load operations (one for each variable), four addition operations, and four store operations. If we use 128-bit SIMD, we will need only two loads, one addition, and one storing. In theory, we have a 4x performance improvement compared to SISD. Considering modern CPUs already have 512-bit registers, we can expect up to a 16x performance gain.
How do you vectorize a program?
In the above section, we saw how SIMD vectorization can greatly improve a program’s performance. So how can you start using this for your own work?
 Intel
Intel
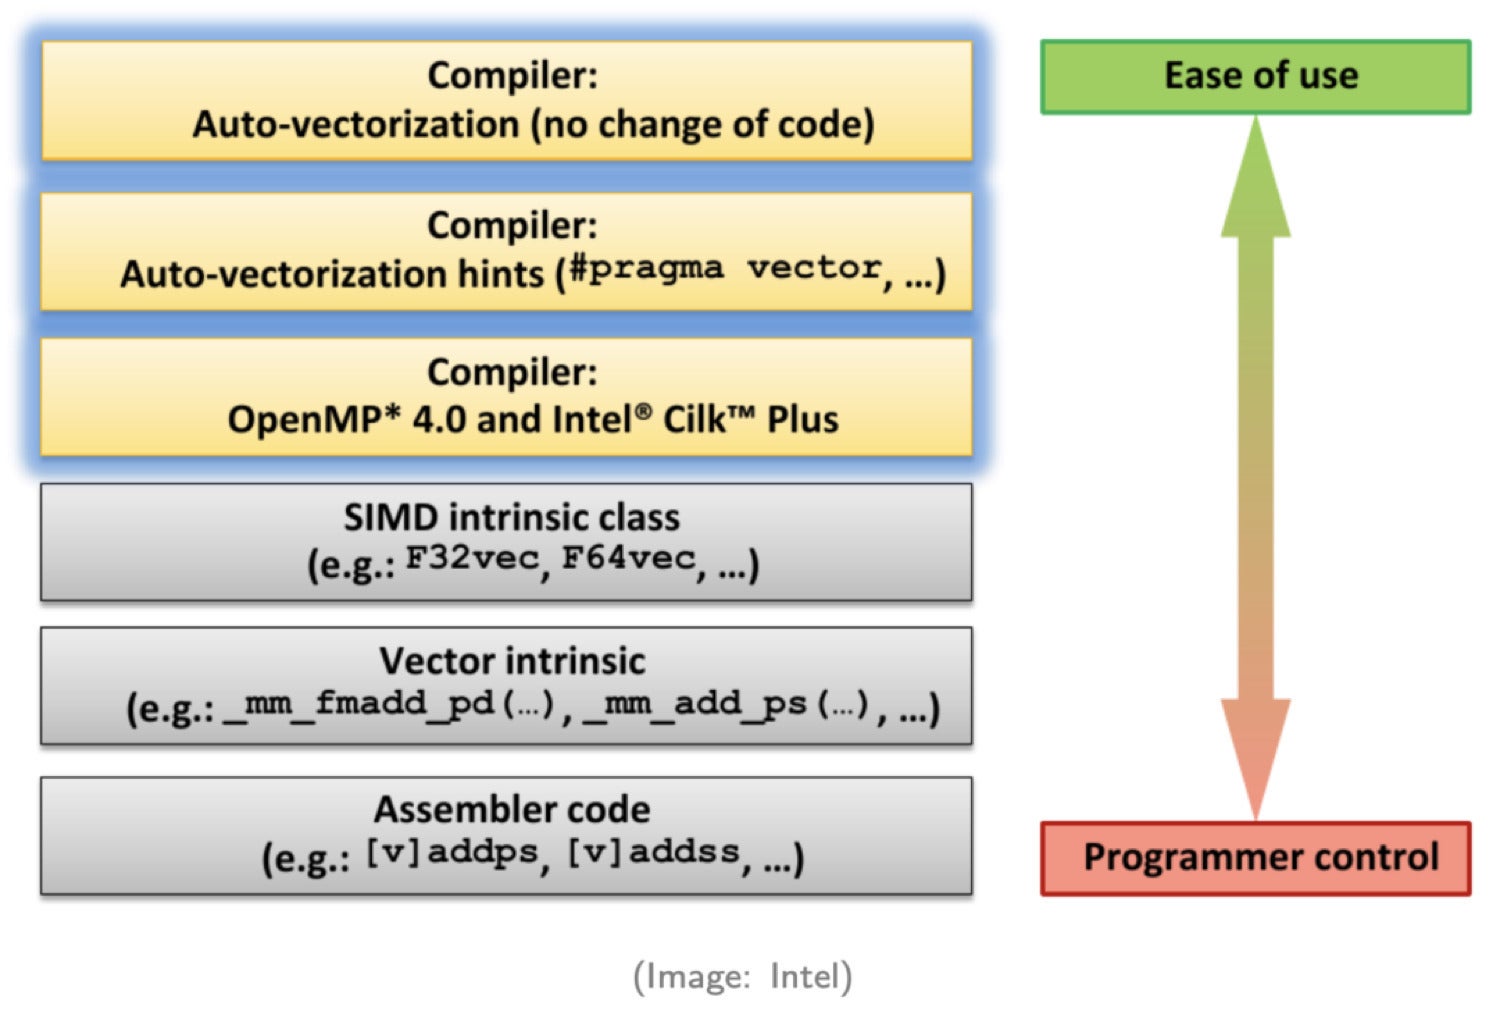
Different ways to invoke SIMD (Intel)
As illustrated in this diagram from Intel, there are six ways SIMD is invoked. Moving from top to bottom, each method demands more expertise from the programmers and requires more coding effort.
Method 1. Auto-vectorization by compiler
Programmers don’t have to make any changes to their code. The compiler will automatically convert scalar code to vector code. Only some simple cases can be auto-converted to vector code.
Method 2. Hint to compiler
In this method, we provide some hints to the compiler. With the extra information provided, the compiler can generate more SIMD code.
Method 3. Parallel programming API
With the help of parallel programming APIs such as OpenMP or Intel TBB, developers can add Pragma to generate vector code.
Method 4. Use SIMD class libraries
These libraries wrap classes that enable SIMD instructions.
Method 5. Use SIMD intrinsics
Intrinsics is a set of assembly-coded functions that let you use C++ function calls and variables in place of assembly instructions.
Method 6. Write assembly code directly
Good luck with this one.
Considering our options above, we want to invoke the compiler’s auto-generated vectorization as much as we can. In other words, we want to focus on methods 1 and 2. For performance-critical operations that can’t be automatically converted to vector code, we’ll use SIMD intrinsics.
Verifying the program has actually generated SIMD code
Here’s an important question we get a lot when we’re talking about vectorization: When a program has a complex code structure, how do we make sure that code execution is vectorized?
There are two ways to check and confirm that the code has been vectorized.
Method 1. Add options to the compiler
With these options, the compiler will generate output regarding if the code is vectorized, and if not, what’s the reason. For example, we can add -fopt-info-vec-all, -fopt-info-vec-optimized, -fopt-info-vec-missed, and -fopt-info-vec-note options to the gcc compiler, as illustrated in the following image.
 CelerData
Method 2. Review the assembly code that gets executed
We can use websites like https://gcc.godbolt.org/ or tools such as Perf and Vtun to check the assembly code. If the registers in the assembly code are xmm, ymm, zmm, etc., or the instructions start with v, then we know this code has been vectorized.
Now that we’re all caught up to speed on the fundamentals of vectorization, it’s time to discuss the performance-boosting power of vectorized databases.
The vectorization of databases
While the StarRocks project has grown into a mature, stable, and industry-leading MPP database (and even spawned an enterprise-ready version from CelerData), the community has had to overcome many challenges to get here. One of our biggest breakthroughs, database vectorization, was also one of our biggest challenges.
Challenges of database vectorization
In our experience, vectorizing a database is much more complicated than simply enabling SIMD instructions in the CPU. It is a large, systematic engineering effort. In particular, we faced six technical challenges:
- End-to-end columnar data. Data needs to be stored, transferred, and processed in columnar format across the storage, network, and memory layers to eliminate “impedance mismatch.” The storage engine and the query engine need to be redesigned to support columnar data.
- All operators, expressions, and functions must be vectorized. This is a daunting task and takes multiple person-years to complete.
- Operators and expressions should invoke SIMD instructions if possible. This requires detailed line-by-line optimization.
- Memory management. To fully leverage the parallel processing power of SIMD CPUs, we have to rethink memory management.
- New data structures. All data structures for the core operators, such as
join,aggregate,sort, etc., need to be designed to support vectorizations from the ground up. - Systematic optimization. Our goal with StarRocks was to improve performance by 5x compared to other market-leading products (with the same hardware configuration). To reach that goal, we had to make sure all components in the database system were optimized.
Vectorizing operators and expressions
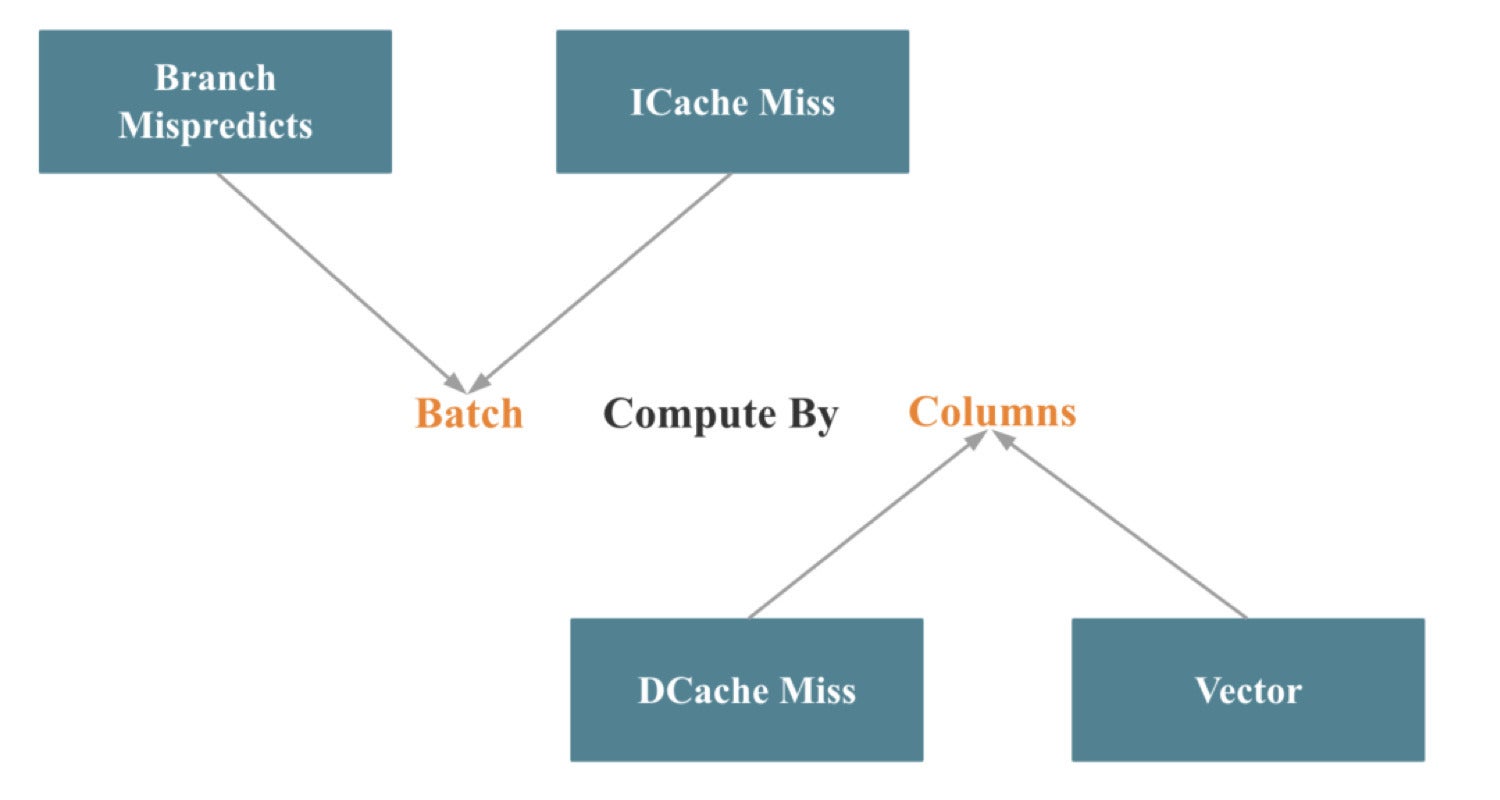
The lion’s share of our engineering efforts when vectorizing StarRocks went into vectorizing operators and expressions. These efforts can be summarized as Batch Compute By Columns, which is illustrated in the following image.
 CelerData
Corresponding to Intel’s Top-down Microarchitecture Analysis Method discussed earlier in this article, Batch reduces branch mispredictions and instruction cache misses. By Columns reduces data cache misses and makes it easier to invoke SIMD optimization.
It is relatively easy to implement Batch computing. The difficult part is the columnar processing for key operators like join, aggregate, sort, and shuffle. Invoking as many SIMD optimizations as possible while doing columnar processing is even more of a challenge, but discussing that would require its own separate article.
How to improve database performance with database vectorization
As we mentioned, vectorizing databases is a systematic engineering effort. In the past few years, we’ve implemented hundreds of optimizations while developing StarRocks. The following are the seven most important areas we focused on for optimization.
High-performance third-party libraries. There are many excellent open source libraries for data structures and algorithms. For StarRocks, we use many third-party libraries such as Parallel Hashmap, Fmt, SIMD Json, and Hyper Scan.
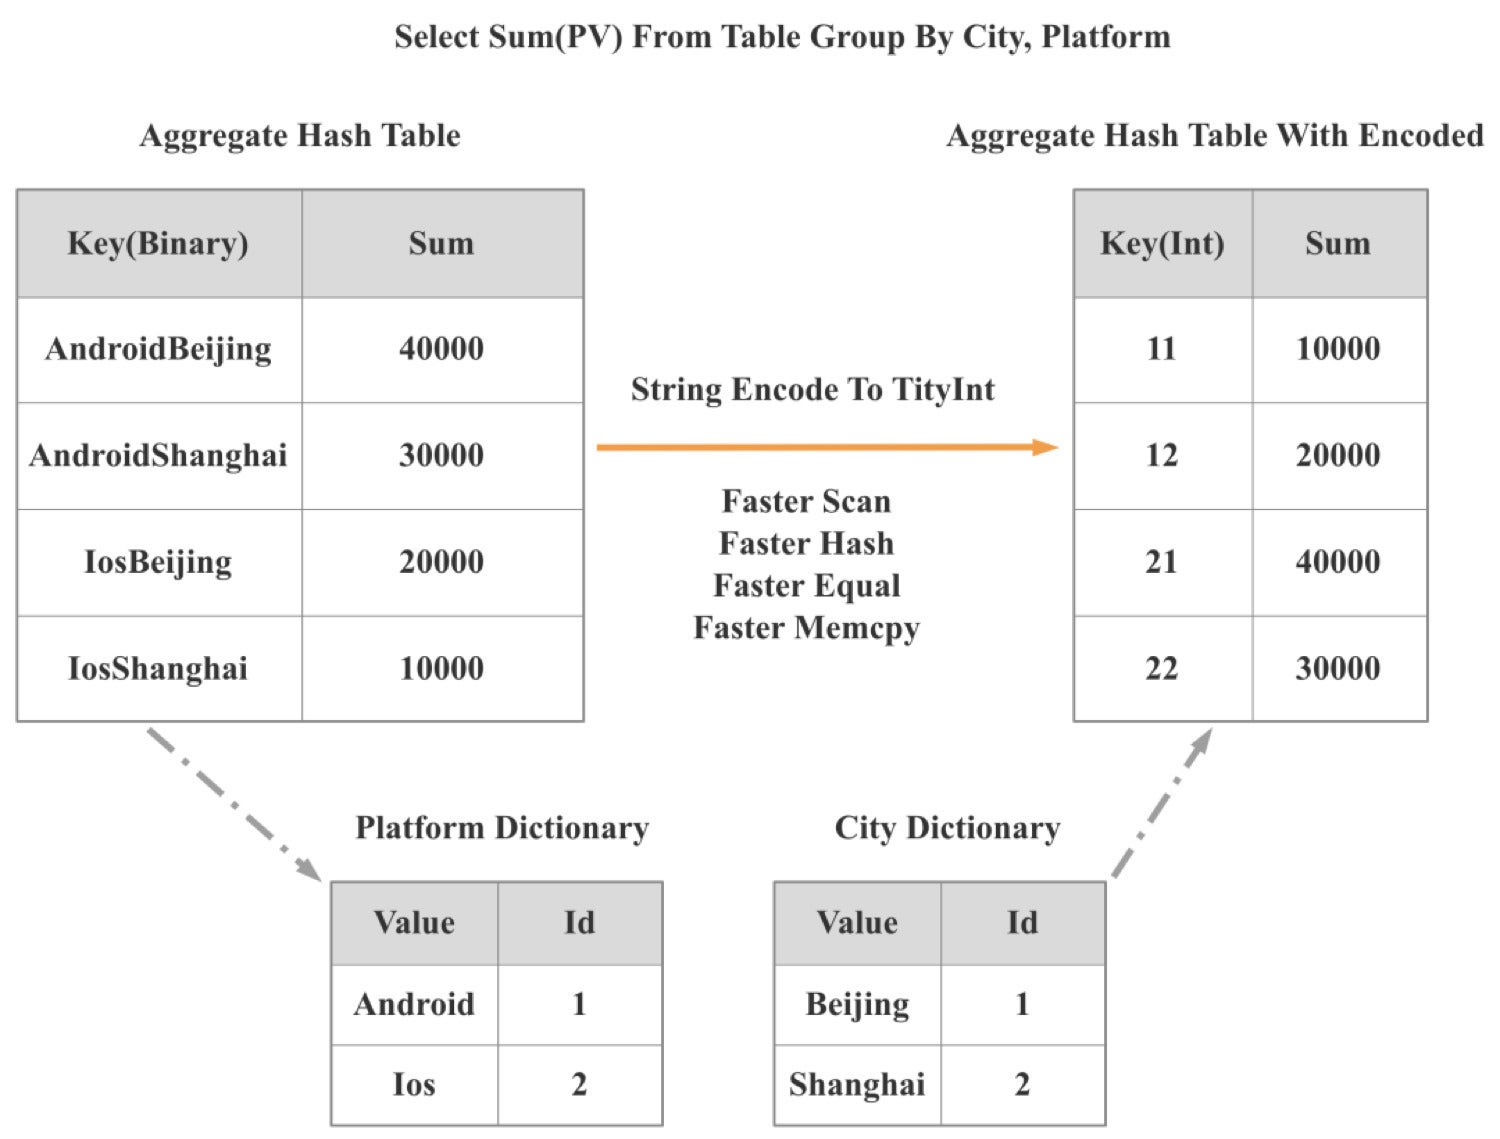
Data structures and algorithms. Highly efficient data structures and algorithms can reduce CPU cycles by an order of magnitude. Because of this, when StarRocks 2.0 launched, we introduced a low-cardinality global dictionary. Using this global dictionary, we can convert string-based operations into integer-based operations.
As illustrated in the following diagram, two string-based group by operations are converted to one integer-based group by operation. As a result, the performance of operations like scan, hash, equal, and mumcpy improved manyfold, and overall query performance improved by more than 300%.
 CelerData
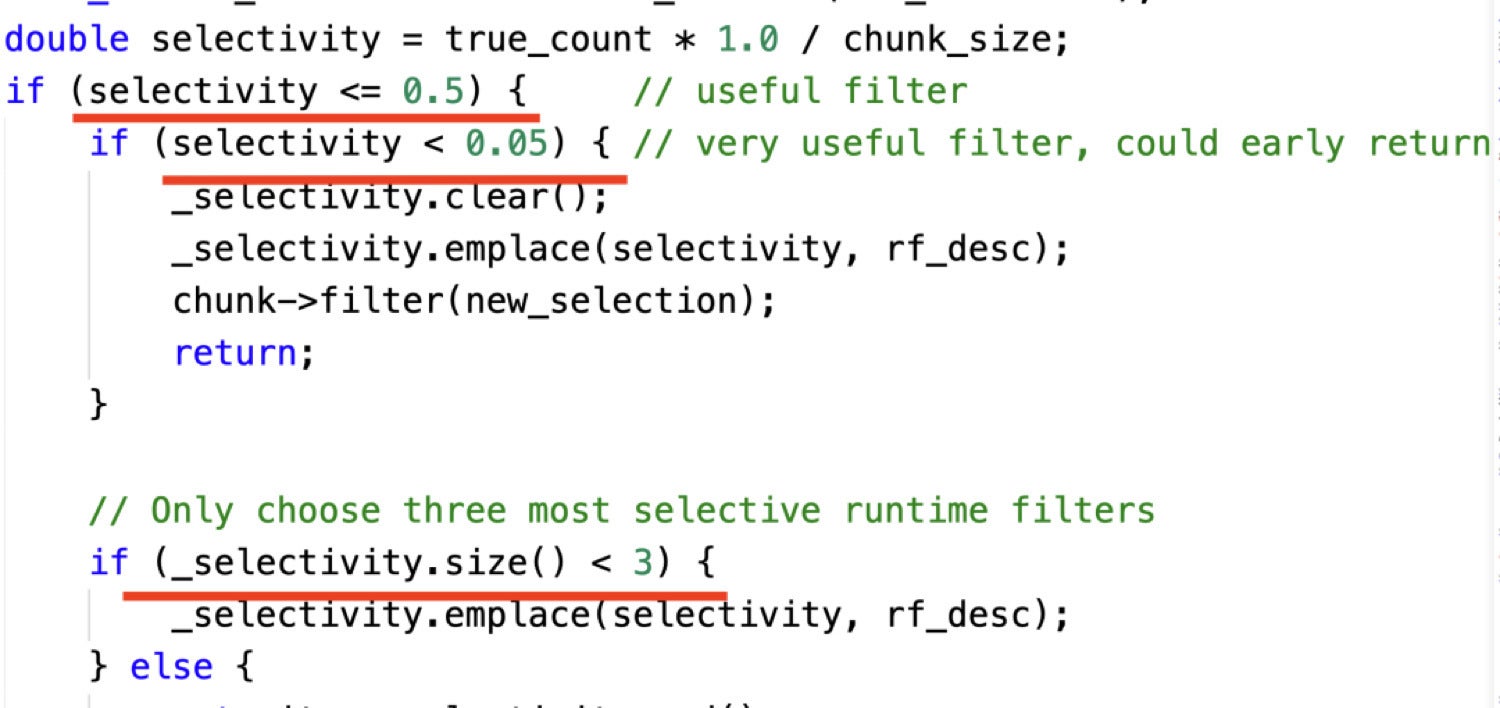
Self-adaptive optimization. If we can understand the context of a query, we can further optimize the query execution. Often, however, we don’t have the query context information until execution time. So our query engine must dynamically adjust its strategy based on the context information it acquires during query execution. This is called self-adaptive optimization.
The following code snippet shows an example where we dynamically choose join runtime filters based on selectivity rate:
 CelerData
There are three decision points that guide the example above:
- If a filter cannot filter the majority of data, then we are not going to use it.
- If a filter can filter almost all of the data, then we only keep this filter.
- We keep at most three filters.
SIMD optimization. As illustrated in the following diagram, StarRocks has a lot of SIMD optimizations in its operators and expressions implementations.
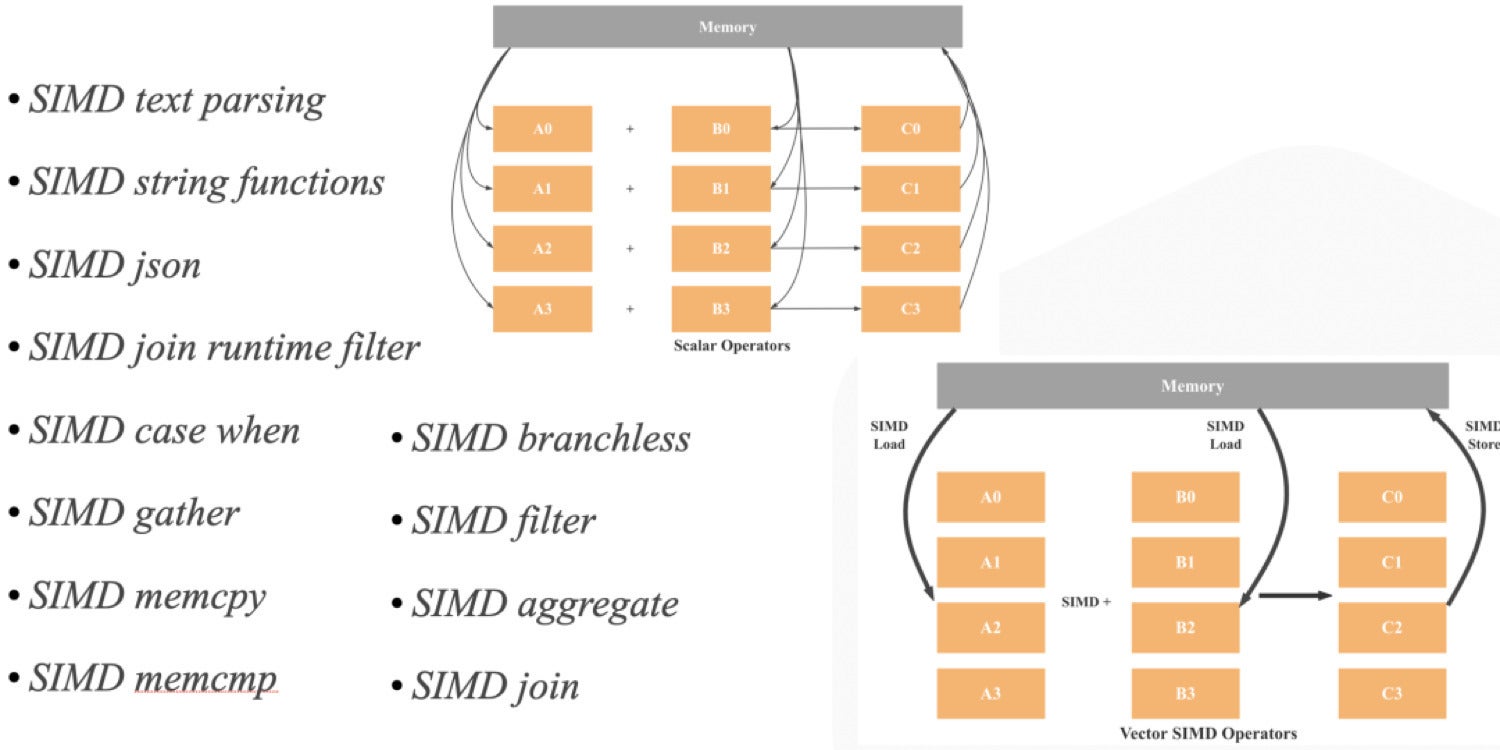 CelerData
C++ low-level optimization. Even with the same data structures and algorithms, the performance of different C++ implementations may vary. For example, a move or copy operation might be used, a vector might be reserved, or a function call might be inline. These are just some of the optimizations we have to consider.
Memory management optimization. The larger the batch size, and the higher the concurrency, the more often memory is allocated and released, and the bigger impact memory management will have on system performance.
With StarRocks, we implemented a column pool data structure to reuse the memory of columns and significantly improved query performance. The code snippet below shows an HLL (HyperLogLog) aggregate function memory optimization. By allocating HLL memory by blocks, and by reusing these blocks, we improved the aggregation performance of HLL five-fold.
 CelerData
CPU cache optimization. CPU cache misses have a huge impact on performance. We can understand this impact in terms of CPU cycles. An L1 cache access needs three CPU cycles, L2 needs nine CPU cycles, L3 needs about 40 CPU cycles, and main memory access needs about 200 CPU cycles. (See Systems Performance by Brendan Gregg.)
CPU cache misses became an especially significant factor for us after we invoked SIMD optimization and the performance bottleneck shifted from CPU bound to memory bound. The following code snippet shows how we reduced CPU misses through prefetching. We’d like to point out, though, that prefetching should be your last resort to optimize CPU caching. This is because it’s very difficult to control the timing and distance of a prefetch.
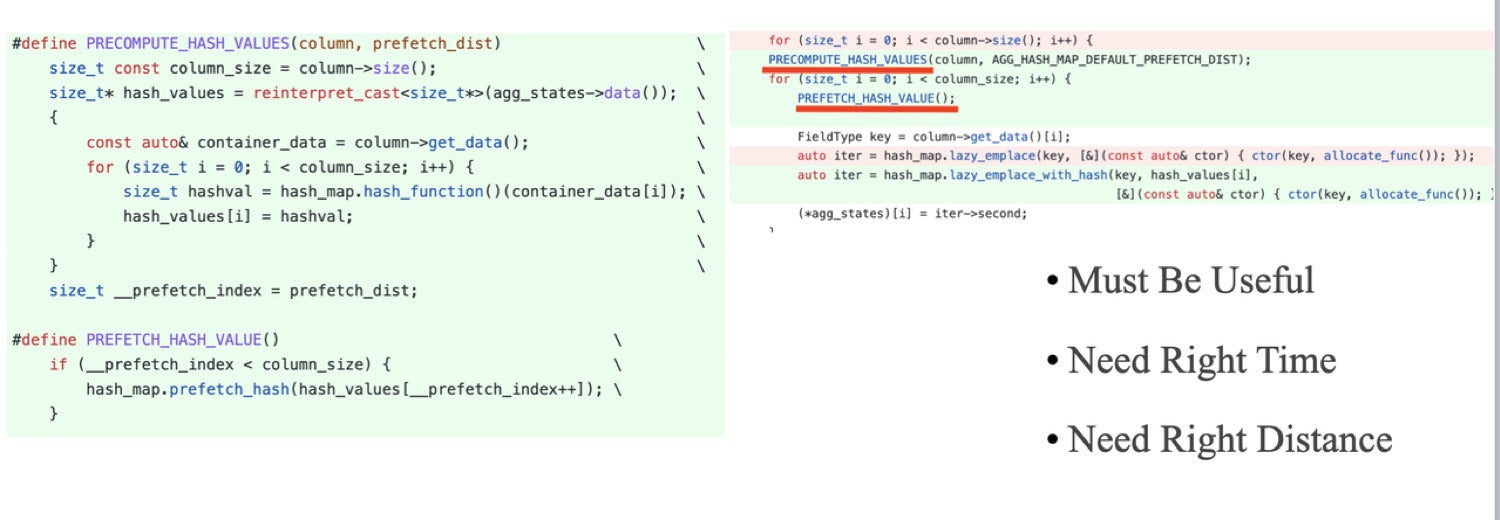 CelerData